
Flush Visualizer
Presentation
Building smooth and visually appealing UI applications requires a keen focus on performance. To achieve efficient UI rendering, minimizing unnecessary work that consumes valuable CPU time is essential.
For example, assuming the application targets 60 FPS to perform a transition between two screens, that means the application has 1/60s ~= 16ms in total to execute the rendering and the flush (see Rendering Pipeline).
The Flush Visualizer is a tool designed to investigate potential performance bottlenecks in UI applications running on the Simulator. It uses the Debug Traces to record the drawings whose target is the display (since UI Pack 14.4.1, see Installation). All other traces (drawings in buffered images and third-party traces of the other libraries) are dropped.
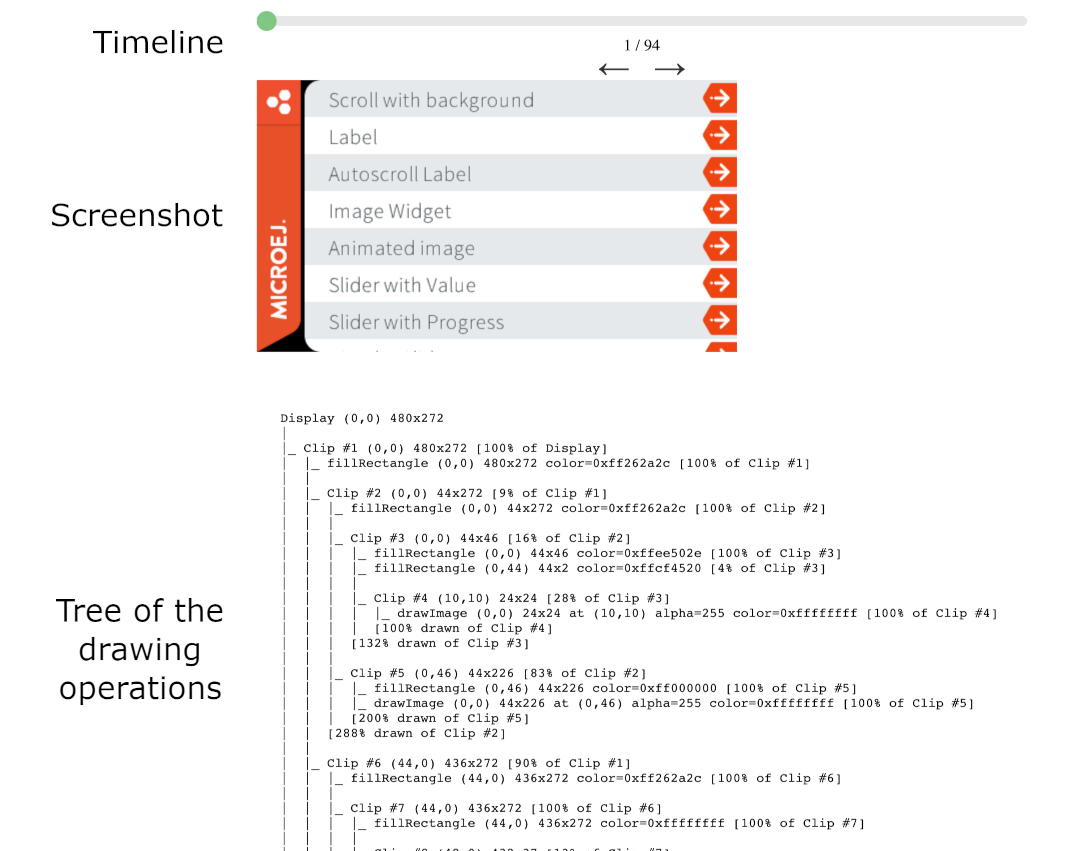
The Flush Visualizer provides the following information:
A timeline with a step for each flush.
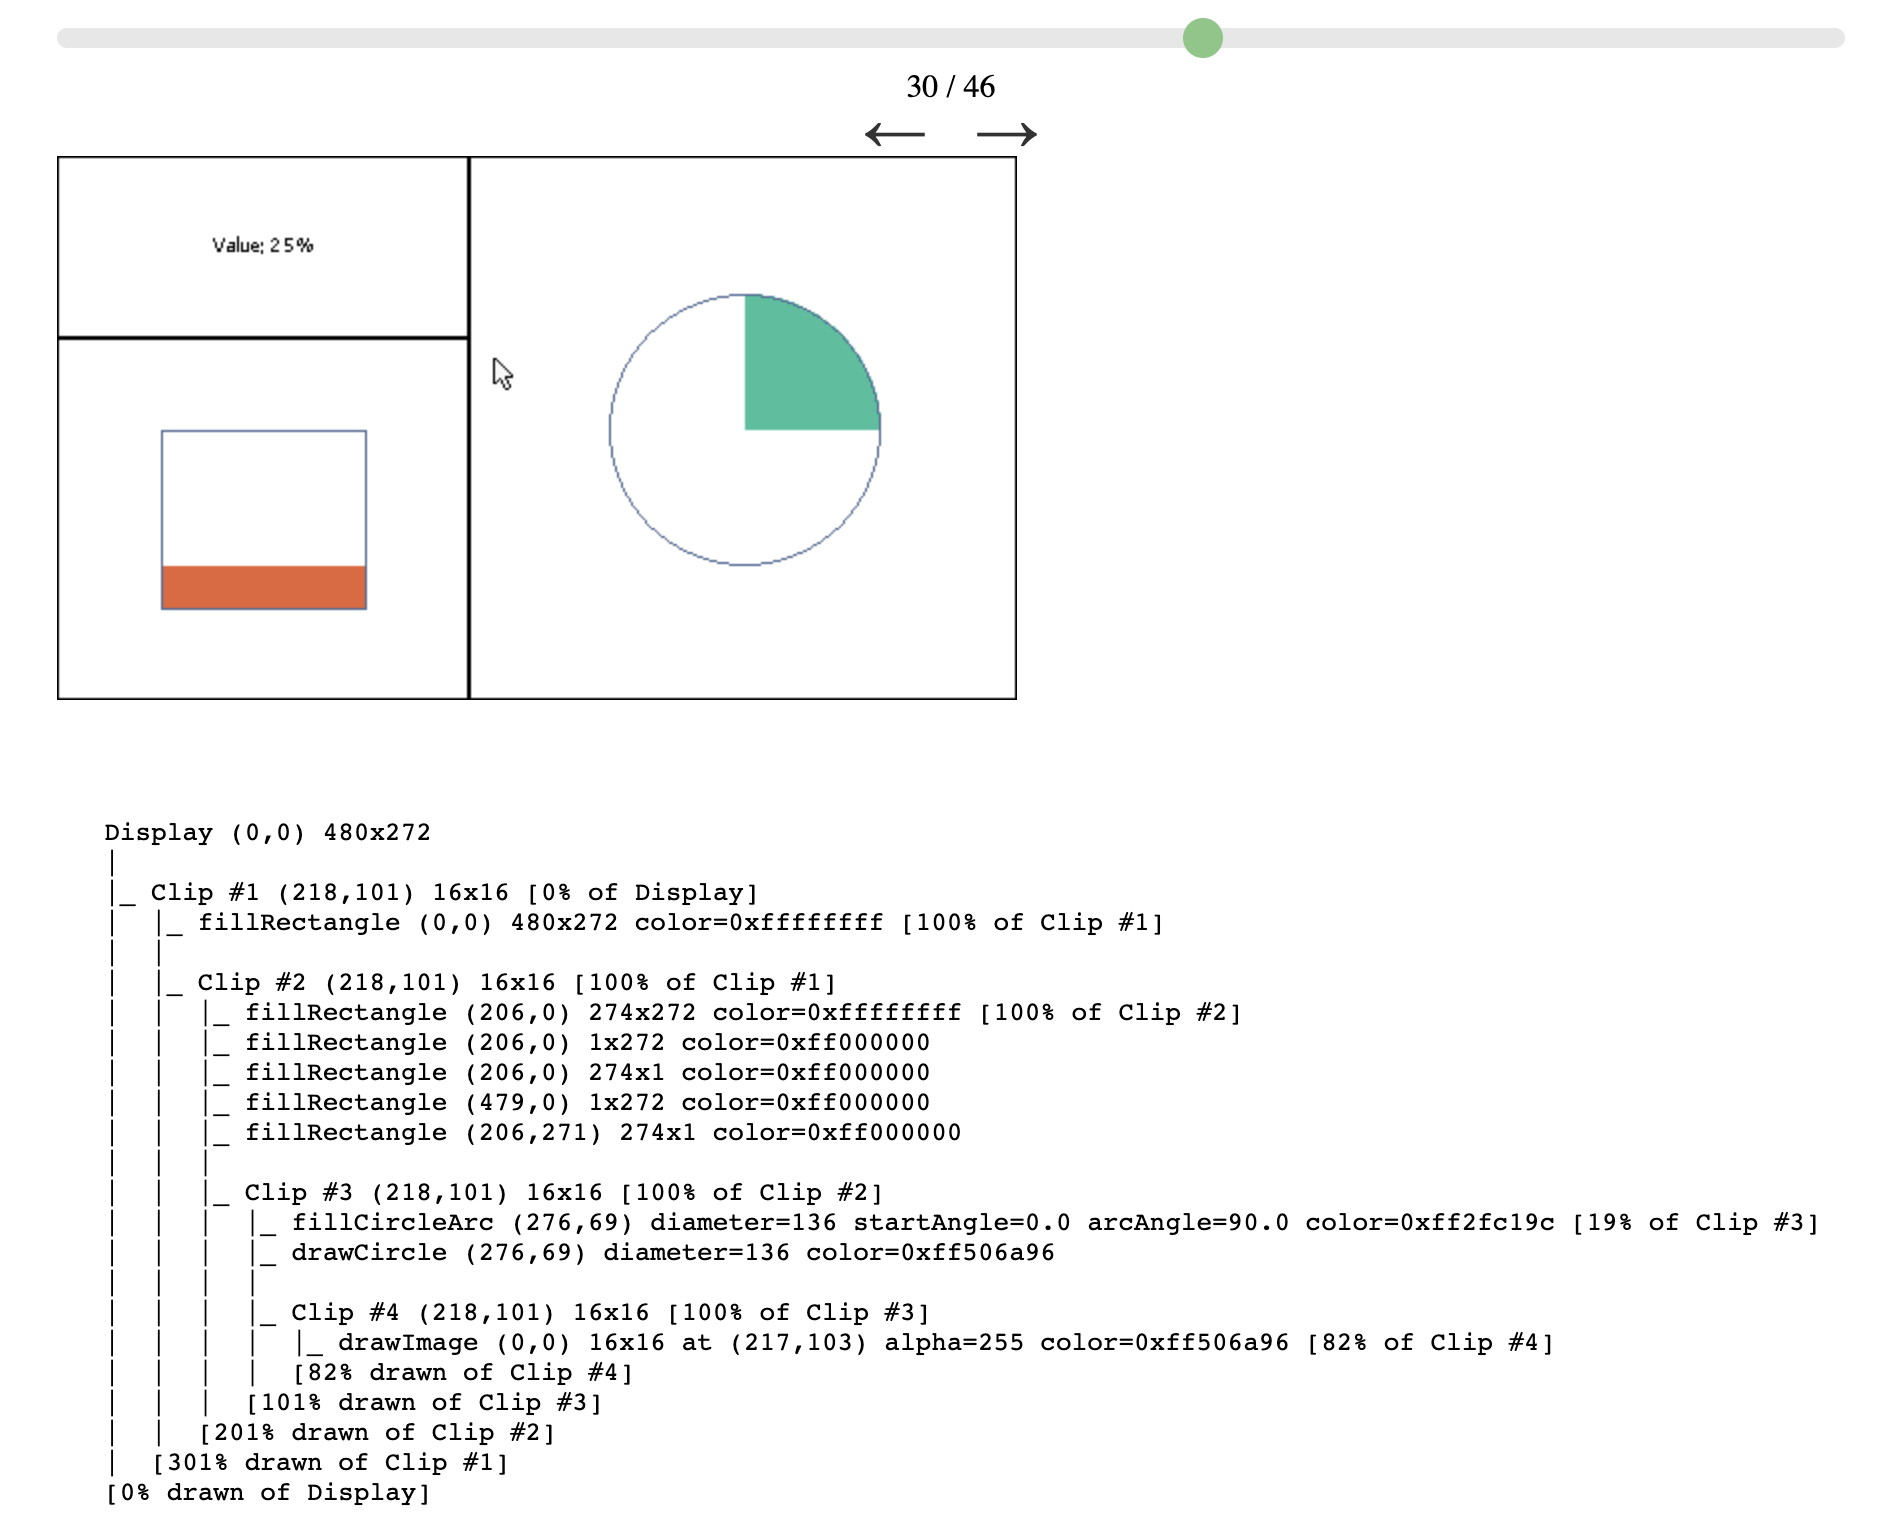
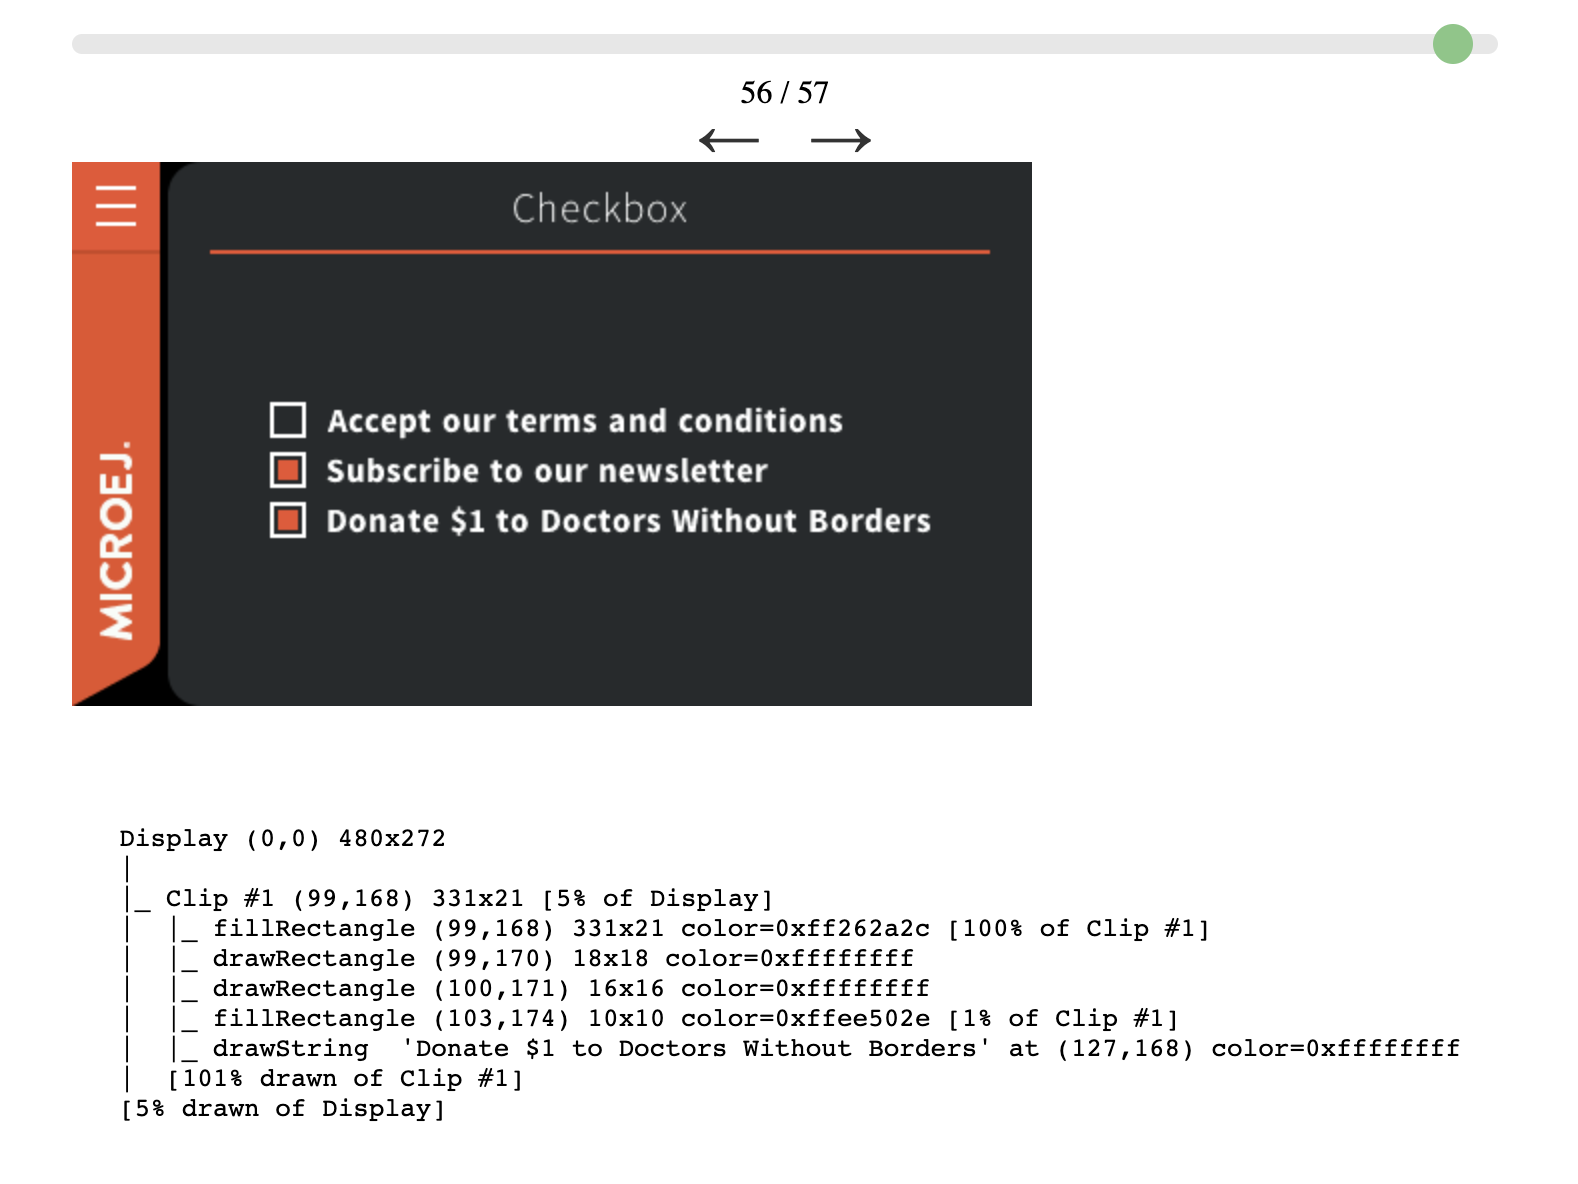
A screenshot of what is shown on the display at flush time.
The list of what is done before this flush (and after the previous one) organized as a tree.
A node of the tree can be either a region (the display or a clip) or a drawing operation.
Each region defines its bounds and can contain one or several other nodes.
Each region also displays the percentage of their parent region they cover.
Some of the drawings can compute the percentage of their parent region they cover.
The others are either negligible or unknown.
At the end of each region, there is a summary of the percentage covered by the drawings in this region (recursively).
Consider this part of the tree:
|_ UI_SetClip #10 dest=0x0 region=(0,0)(44x46)  [16.91% of UI_SetClip #9]
|  |
|  |_ MWT_Render #11 (MWT) [dest=0x0] Render a widget (ID = 61) region=(0,0)(44x46)         [100.00% of UI_SetClip #10]
|  |  |_ UI_SetForegroundColor dest=0x0 color=0xffee502e
|  |  |
|  |  |_ UI_FillRectangle dest=0x0 anchor=0,0 size=44x46
|  |  |  |_ UI_DrawnRegion dest=0x0 clipDisabled=true region=(0,0)(44x46) [100.00% of MWT_Render #11]
|  |  |_ UI_FillRectangle  Drawing operation done
|  |  |_ UI_SetForegroundColor dest=0x0 color=0xffcf4520
|  |  |
|  |  |_ UI_FillRectangle dest=0x0 anchor=0,44 size=44x2
|  |  |  |_ UI_DrawnRegion dest=0x0 clipDisabled=true region=(0,44)(44x2) [4.35% of MWT_Render #11]
|  |  |_ UI_FillRectangle  Drawing operation done
|  |  |
|  |  |_ UI_SetClip #12 dest=0x0 region=(0,0)(44x44)  [95.65% of MWT_Render #11]
|  |  |  |
|  |  |  |_ UI_SetClip #13 dest=0x0 region=(10,10)(24x24)  [29.75% of UI_SetClip #12]
|  |  |  |  |_ UI_SetForegroundColor dest=0x0 color=0xffffffff
|  |  |  |  |
|  |  |  |  |_ UI_DrawImage dest=0x0 image=0x3 from 0,0 size=24x24 anchor=10,10 alpha=255
|  |  |  |  |  |_ UI_DrawnRegion dest=0x0 clipDisabled=true region=(10,10)(24x24) [100.00% of UI_SetClip #13]
|  |  |  |  |_ UI_DrawImage  Drawing operation done
|  |  |  |  [100.00% drawn of UI_SetClip #13]
|  |  |  [29.75% drawn of UI_SetClip #12]
|  |  [132.81% drawn of MWT_Render #11]
|  |_ MWT_Render  (MWT) Widget render done (ID = 61)
|  [132.81% drawn of UI_SetClip #10]
We can see that:
The MWT_Render #11 is 100% of the clip #10, which is 16.91% of the clip #9.
It draws 2 rectangles and an image that take respectively 100%, 4.35% and 100% of their parent region.
The clip #13 is fully covered by the image (100%).
The clip #10 is covered at 132.81%: 100% for the 1st rectangle, 4.35% for the 2nd, 28.46% for the clip #12 and its inner image (29.75 x 95.65%)
A value of 100% indicates that the area drawn is equivalent to the surface of the region. A value of 200% indicates that the area drawn is equivalent to twice the surface of the region. A perfect application has 100% of its root region drawn but its very unlikely for an application that draws anything else than a rectangle or an image. A total area drawn between 100% to 200% is the norm in practice because widgets often overlap. However, if the total area drawn is bigger than 200%, that means that the total surface of the region was drawn more than twice. Probably meaning that a lot of drawings are done above others. Identifying this drawing (and the ones below) can help reducing the number of drawings done (or their surface).
As always, when conducting a performance study, measure. Use SystemView to identify the bottlenecks in your application on the embedded target. A total area drawn over 200% is inefficient, but your application may have bigger bottlenecks. Confirm it by measuring the time spent drawing vs. the time spent elsewhere between flushes.
Installation
The Flush Visualizer option is available for the Display widget in
frontpanel widget module
version 4.+ for UI Pack 14.0.0 or later.
Set the property
core.trace.enabledtotrueto enable the Flush Visualizer.Set the property
core.trace.autostarttotrueto start the recording on startup.Start and pause the recording by clicking on the button
 .
.
Set the property
ej.fp.display.flushVisualizertotrueto enable the Flush Visualizer.
Refer to the Standalone Application Options documentation to set the option.
Usage
Run the application in the Simulator.
Since UI Pack 14.3.0, the button
 in the toolbar of the Front Panel opens the Flush Visualizer.
The file
MicroUIFlushVisualizer/MicroUIFlushVisualizer.htmlis generated in the application output folder and can be opened during or after the execution.
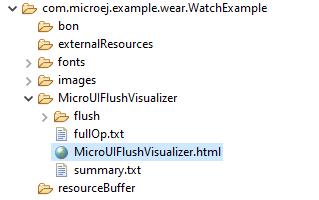
Note
Since MICROEJ SDK 6, the application output folder is located under the build/output/ folder.
Examples
Here are examples of the Flush Visualizer in action:
MVC Demo |
Widget Example |
|---|---|
|
|