
Heap Usage Monitoring
Introduction
When building a Standalone Application, the Managed Heap size must be specified as an Application Option (see Option(text): Managed Heap size (in bytes)). The value to set in this option depends on the maximum heap usage, and the developer can estimate it by running the application.
The Core Engine provides a Java API to introspect the heap usage at runtime. Additionally, heap usage monitoring can be enabled to compute the maximum heap usage automatically.
Here are the descriptions of the different notions related to heap usage:
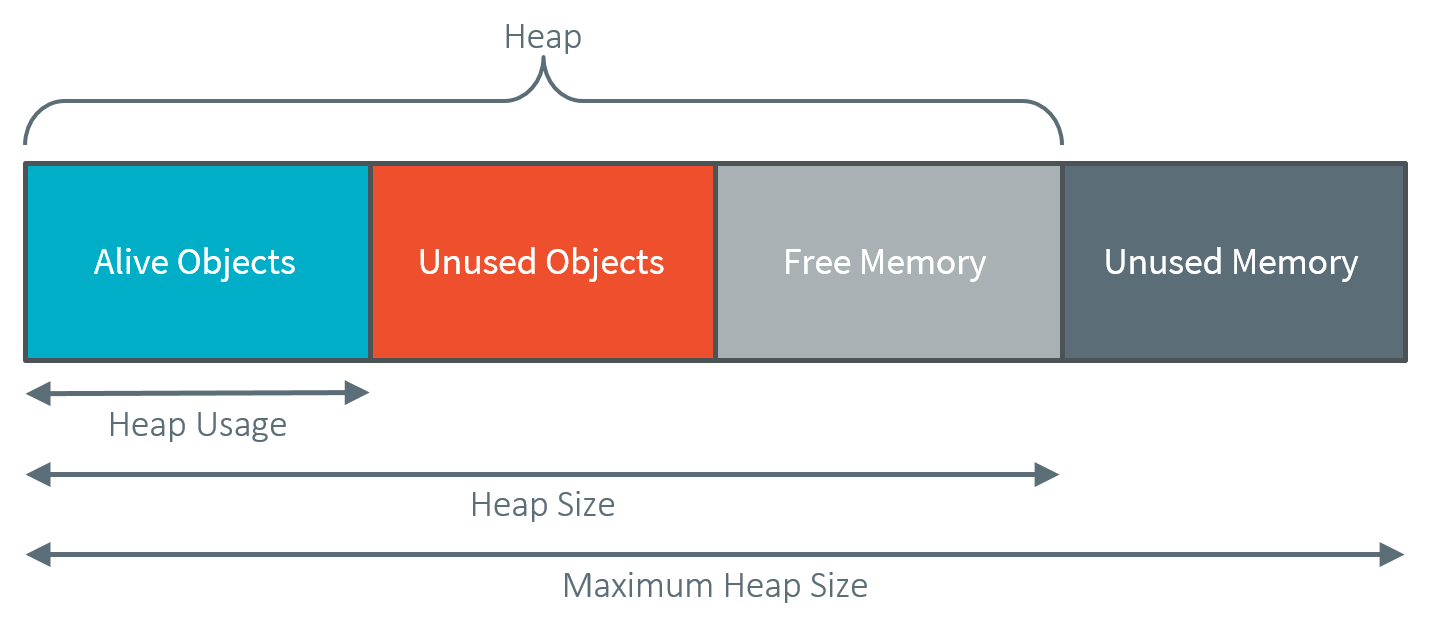
Heap: memory area used to store the objects allocated by the application.
Heap Size: current size of the heap.
Maximum Heap Size: maximum size of the heap. The heap size cannot exceed this value. See Option(text): Managed Heap size (in bytes).
Heap Usage: the amount of the heap currently being used to store alive objects.
Garbage Collector (GC): a memory manager in charge of recycling unused objects to increase free memory.
Heap Structure Summary
The Java class java.lang.Runtime defines the following methods:
Runtime.gc(): Runs the garbage collector. This is a blocking operation that reclaims all unreachable objects and defragments the Managed Heap. System.gc() is an alternative way of invoking this method.
Runtime.freeMemory(): Returns the amount of free memory in the heap. This value does not include unused objects eligible for garbage collection. Calling the gc() method may result in increasing the value returned by this method.
Runtime.totalMemory(): Returns the current size of the heap. The value returned by this method may vary over time.
Runtime.maxMemory(): Returns the maximum size of the heap.
Starting from Architecture 8.6.0, the BON API Util.gcReclaimDeadObjects() triggers the minimal garbage collection cycle required to reclaim unreachable objects in the Managed Heap. Unlike a full garbage collection, this operation focuses only on reclaiming dead objects without performing a complete heap compaction. This allows the runtime to quickly free memory that is no longer referenced by the application while minimizing the impact on execution time. As a result, after calling this method, the runtime can report the exact amount of free memory available in the heap.
Heap Usage Introspection
The methods provided by the Runtime class allow introspecting heap usage by comparing the heap size and the free memory size. A garbage collection must normally be executed before computing the heap usage to recycle all unused objects and ensure that only live objects are counted.
The Util.gcReclaimDeadObjects() API provides an alternative approach by reclaiming dead objects and returning the current free memory without triggering a full garbage collection, making it unnecessary to call gc() beforehand.
The application can compute the current heap usage by executing the following code:
Runtime runtime = Runtime.getRuntime(); // get Runtime instance
long heapUsage = runtime.totalMemory() - Util.gcReclaimDeadObjects();
Runtime runtime = Runtime.getRuntime(); // get Runtime instance
runtime.gc(); // Ensure unused objects are recycled
long heapUsage = runtime.totalMemory() - runtime.freeMemory();
This example gives the heap usage at a given point but not the maximum heap usage of the application.
Note
When heap usage monitoring is disabled, the heap size is fixed, and so Runtime.totalMemory() and Runtime.maxMemory() return the same value.
Automatic Heap Usage Monitoring
The maximum heap usage of an application’s execution can be computed automatically by enabling heap usage monitoring.
Note
This feature is available in the Architecture versions 7.16.0 or higher for the Applications deployed on hardware devices (not on Simulator).
When this option is activated, an initial size for the heap must be specified, and the Core Engine increases the heap size dynamically. The value returned by Runtime.totalMemory() is the current heap size. Runtime.maxMemory() returns the maximum size of the heap. A call to Runtime.gc() decreases the heap size to the higher value of either the heap usage or the initial heap size.
At any moment, Runtime.totalMemory() returns the maximum heap usage of the current execution (assuming the maximum heap usage is higher than the initial heap size, and Runtime.gc() has not been called).
See the section Option(checkbox): Enable Managed Heap usage monitoring to enable this option and configure the initial heap size.
Even if the heap size can vary during time, a memory section of Runtime.maxMemory() bytes is allocated at link time or during the Core Engine startup. No dynamic allocation is performed when increasing the heap size.
Warning
A small initial heap size will impact the performances as the GC will be executed every time the heap size needs to be increased.
Furthermore, the smaller the heap size is, the more frequent the GC will occur. This feature should be used only for heap usage benchmarking.
Heap Usage Analysis
To analyze heap usage and see what objects are alive in the application, use the Heap Dumper & Heap Analyzer tools (on SDK 6, on SDK 5).