
Run on Simulator
In order to execute an Application on the Simulator, the SDK provides the Gradle runOnSimulator task.
The prerequisites of this task are:
The Application EntryPoint must be configured, as described in Configure a Project.
The target VEE must be defined:
If your VEE is a VEE Port, refer to the Select a VEE Port page to know the different ways to provide a VEE Port for a module project.
If your VEE is a Kernel, refer to the Select a Kernel page to know the different ways to provide a Kernel for a module project.
Once these prerequisites are fulfilled, the Application can be started with the Simulator:
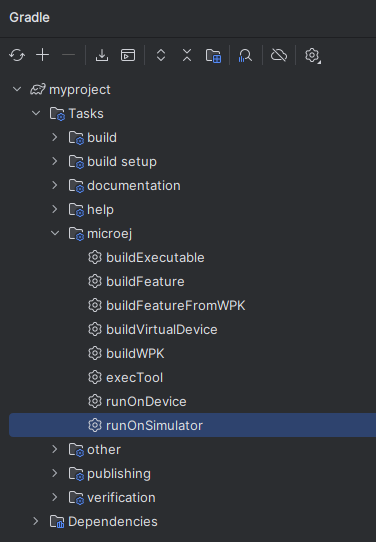
By double-clicking on the runOnSimulator task in the Gradle tasks view:
Warning
Android Studio does not allow to run multiple Gradle tasks in parallel. If you still want to execute several Gradle tasks simultaneously, you can launch them from a terminal with the Gradle Command Line Interface (CLI).
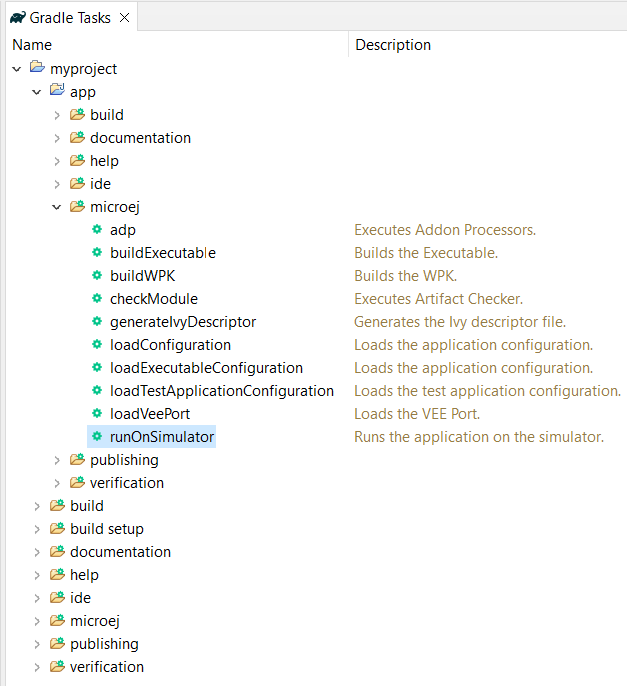
By double-clicking on the runOnSimulator task in the Gradle tasks view:
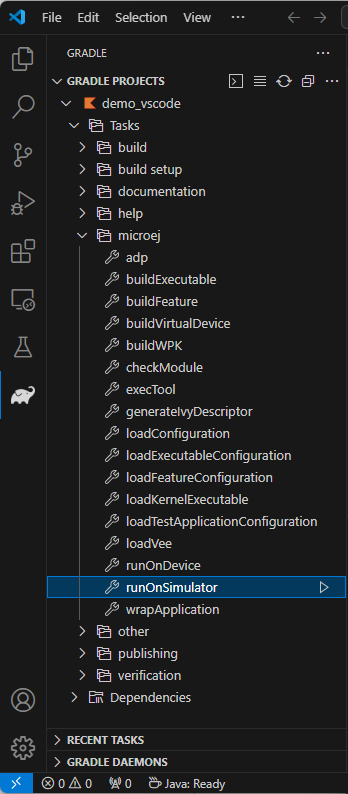
By double-clicking on the runOnSimulator task in the Gradle tasks view:
From the command line interface:
$ ./gradlew runOnSimulator
With a simple Hello World Application, the output should be:
=============== [ Initialization Stage ] ===============
=============== [ Converting fonts ] ===============
=============== [ Converting images ] ===============
=============== [ Launching on Simulator ] ===============
Hello World!
=============== [ Completed Successfully ] ===============

SUCCESS
Warning
The execution of the runOnSimulator task can fail if the SDK EULA has not been accepted.
In that case, you can set the ACCEPT_MICROEJ_SDK_EULA_V4_1A environment variable to YES and
restart your IDE or you can define the accept-microej-sdk-eula-v4-1a System property
by creating a custom configuration.
For more information about SDK EULA, refer to the Licenses chapter.
Verbose Mode
If you need more information about the execution of the Application with the Simulator,
the verbose mode can be enabled by using the --info Gradle option:
./gradlew runOnSimulator --info
Debug on Simulator
The SDK allows to run an Application with the Simulator in debug mode by setting the project property debug.mode to true
when executing the runOnSimulator task:
./gradlew runOnSimulator -P"debug.mode"=true
The debug mode is activated on the port 12000 by default.
The port can be changed by using the project Property debug.port:
./gradlew runOnSimulator -P"debug.mode"=true -P"debug.port"=8000
Once started, the Simulator waits for the connection of a debugger.
If you want to connect the IDE debugger:
Warning
IntelliJ IDEA and Android Studio need an Architecture 8.1 or higher for debug mode.
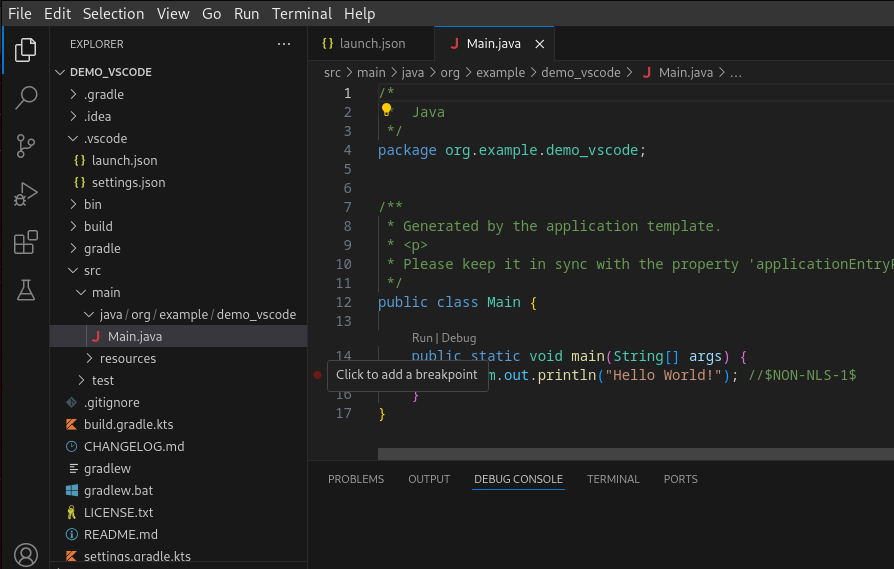
Add a breakpoint in your Application code.
Click on Run > Edit Configurations….
Click on + button (Add New Configuration).
Select Remote JVM Debug.
Click on the New launch configuration button.
Give a name to the launcher in the Name field.
Set the debug host and port.
Click on the Debug button.
Add a breakpoint in your Application code.
Click on Run > Debug Configurations….
Select Remote Java Application.
Click on the New launch configuration button.
Give a name to the launcher in the Name field.
Set the debug host and port.
Click on the Debug button.
Warning
VS Code needs an Architecture 8.1 or higher for debug mode.
Add a breakpoint in your Application code.
Click on the Run and Debug (Ctrl+Shift+D) icon on the right panel.
Click on
create a launch.json filein the opened panel.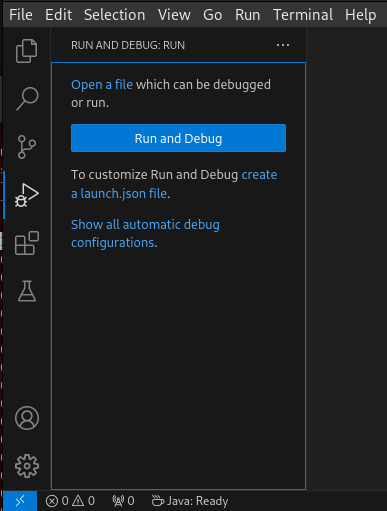
Click on the
Javaentry proposed in the search field.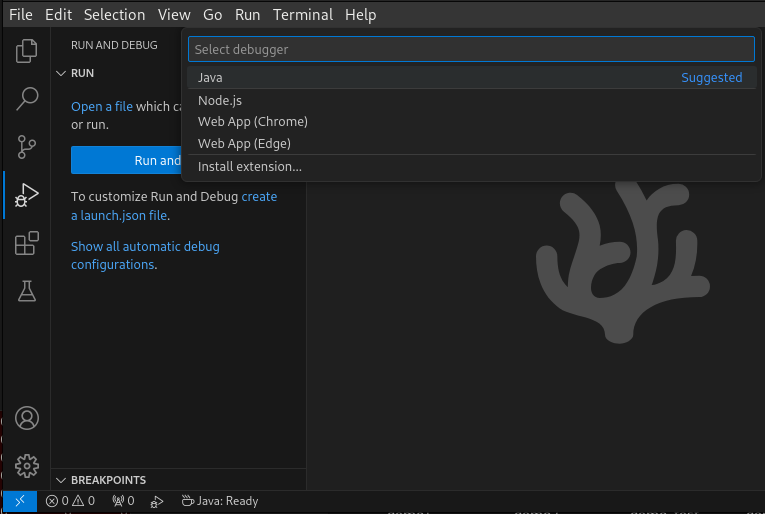
Click on Add Configuration button
Select
{} Java: Attach to Remote Programentry in the popup list.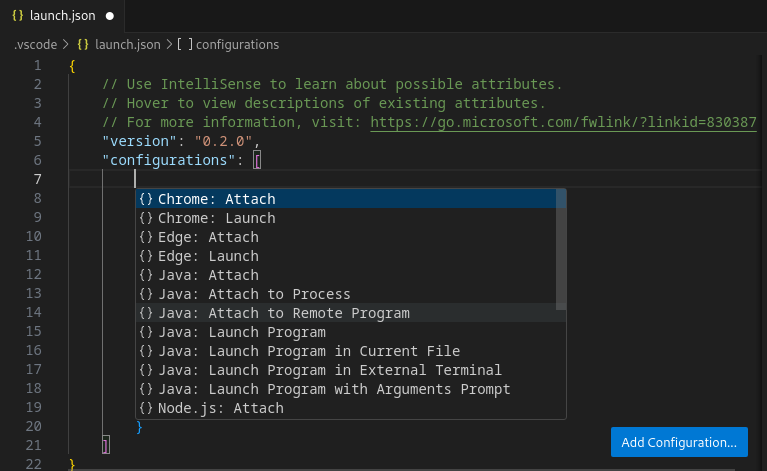
Set
localhostashostNameand theport(default is1200) in the generated json.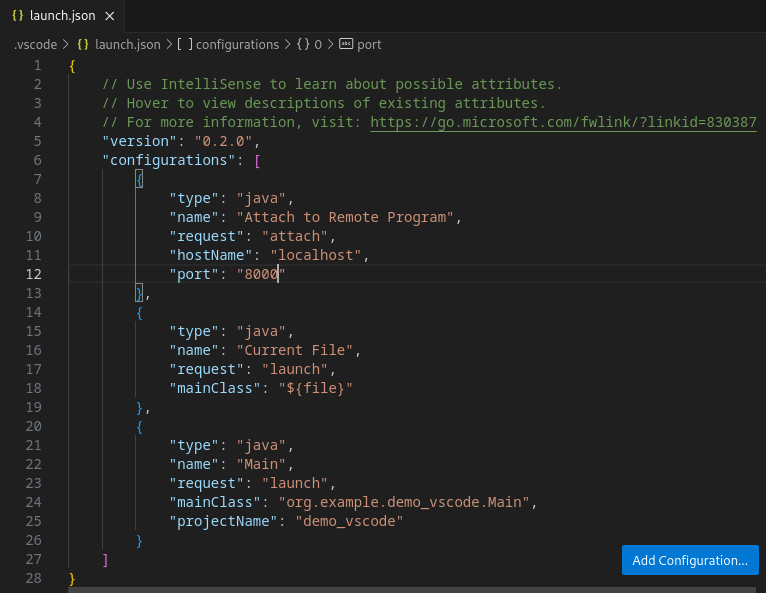
Select
Attach to Remote Programin the selection box of the launcher.
Click on the
Startbutton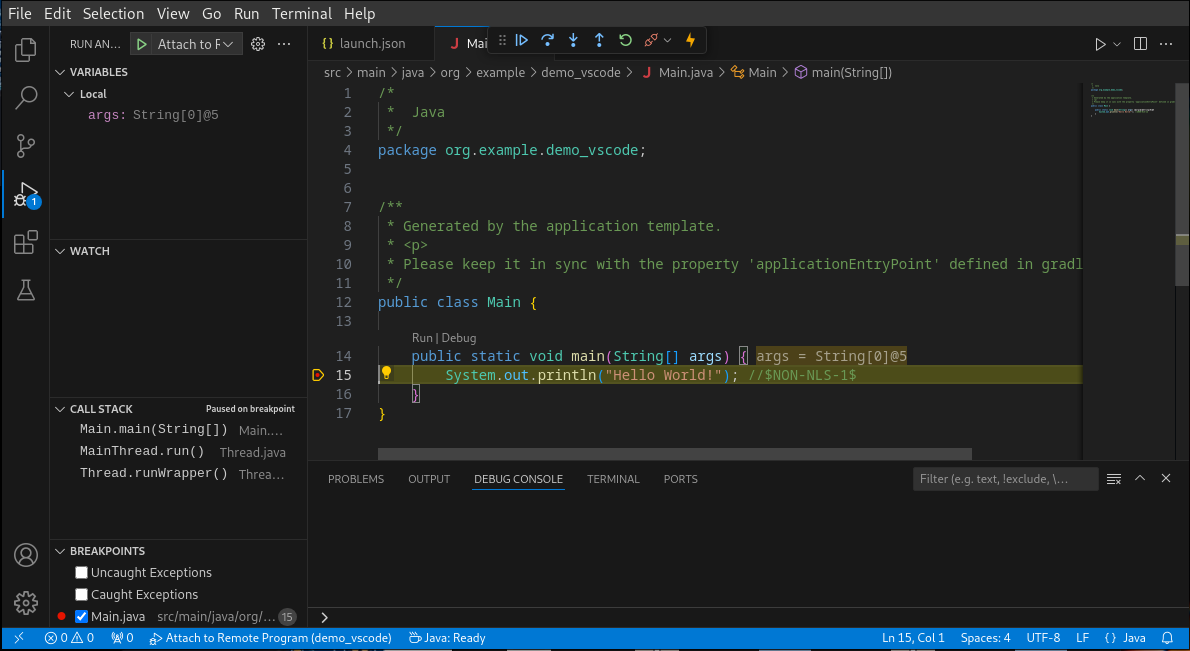
The debugger should connect to the Simulator and you should be able to debug your Application.
Generate Code Coverage
To generate the Code Coverage files (.cc), invoke the :runOnSimulator task as follow:
./gradlew :runOnSimulator -D"microej.option.s3.cc.thread.period=15" -D"microej.option.s3.cc.activated=true"
Option Name: s3.cc.thread.period
Description:
It specifies the period between the generation of .cc files.
Note
If the application is abruptly ended (for example with Ctrl-C) before the first period, no .cc files are generated.
Option Name: s3.cc.activated
Description
Set to true to enable the generation of Code Coverage files, don’t define the property to disable the generation.
Generate Heap Dump
Option Name: s3.inspect.heap
Description:
Set to true to enable a dump of the heap each time the System.gc() method is called by the MicroEJ Application.
The .heap files are generated in build/output/application/heapDump/.
Use the Heap Viewer to visualize the .heap files.
Run several Applications on Simulator
When a Multi-Sandbox Kernel is provided, it is possible to execute your Application on the Simulator along with additional Applications. To run an additional Application on the Simulator, the Application must be declared as a dependency of the project:
When the Application is published in an artifact repository, you can use it by declaring a Module dependency:
dependencies {
   microejApplication("com.mycompany:myapp:1.0.0")
}
When the Application is a subproject of a multi-project, you can use it by declaring a Project dependency in the
build.gradle.ktsfile, with themicroejApplicationconfiguration:dependencies { microejApplication(project(":myApplication")) }
You can also use the Application WPK file directly by declaring a File dependency in the
build.gradle.ktsfile, with themicroejApplicationconfiguration:dependencies { microejApplication(files("C:\\path\\to\\my\\application.wpk")) }
Warning
Only modules with the Application Module Nature can be declared this way (modules built with the
com.microej.gradle.applicationplugin). Declaring a module with another Module Nature would make the build fail.