
Memory Map Analyzer
Principle
When the Executable of an Application is built, a Memory Map file is generated. This file can be visualized with the Memory Map Analyzer, an Eclipse IDE plug-in. It displays the memory consumption of different features in the RAM and ROM.
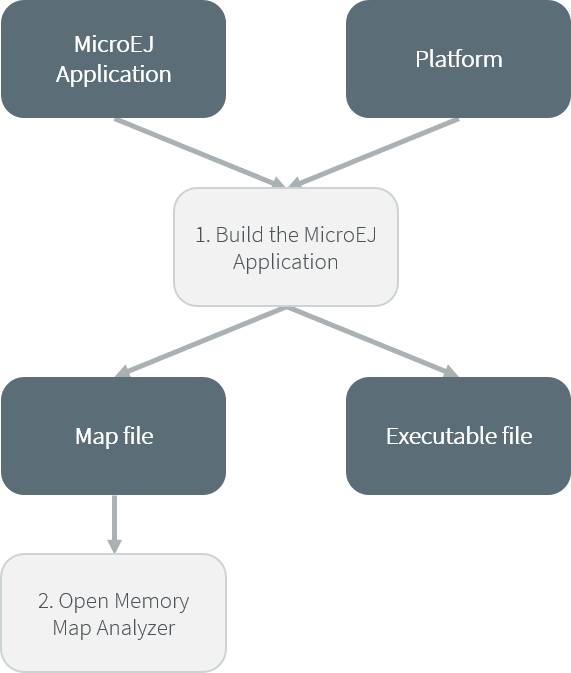
Memory Map Analyzer Process
Use
When the Executable file of an Application has been produced,
the Memory Map file is available at build/application/object/soar/<main-class-full-name>.map.
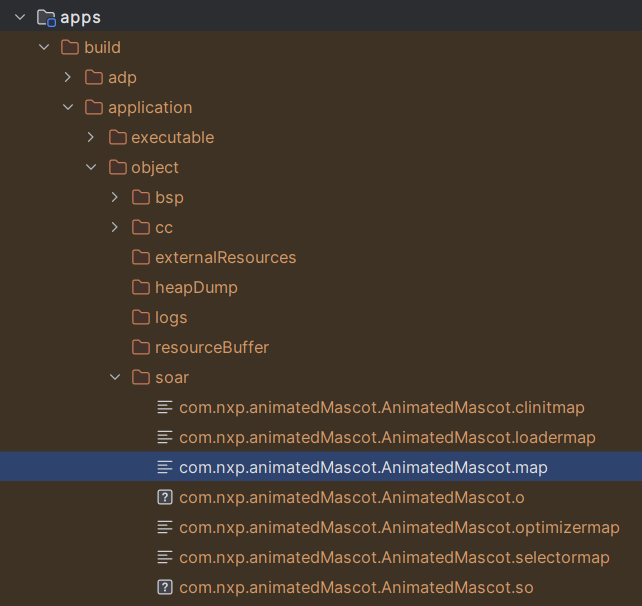
Memory Map File
You can visualize it by following these steps:
Make sure the Eclipse IDE is installed with the required plugin, then launch it.
Click on File > Open File….
Select the Memory Map file.
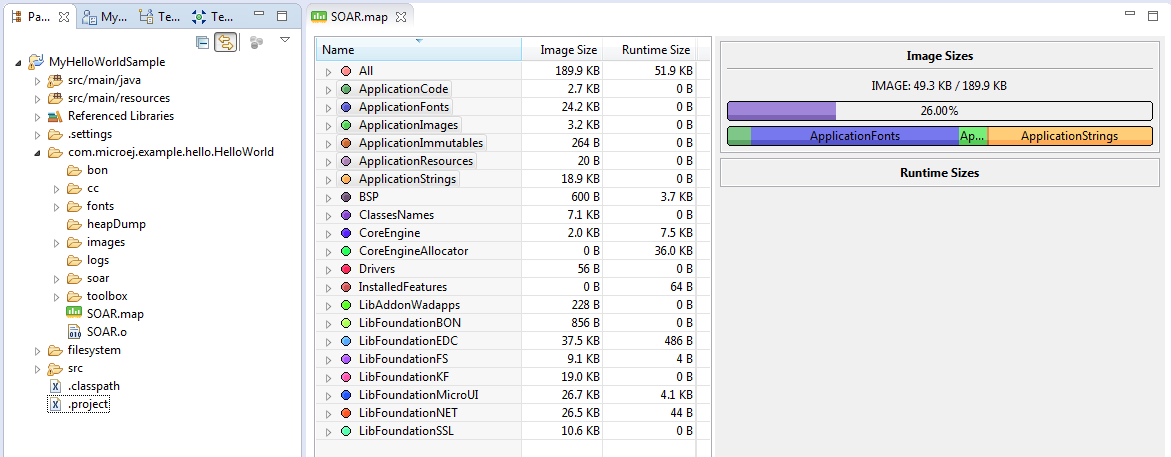
Consult Full Memory
You can select an item (or several) to show the memory used by this item(s) on the right,
or select All to show the memory used by all items.
This special item performs the same action as selecting all items in the list.
You can also select an item in the list, and expand it to see all symbols used by the item. This view is useful in understanding why a symbol is embedded.
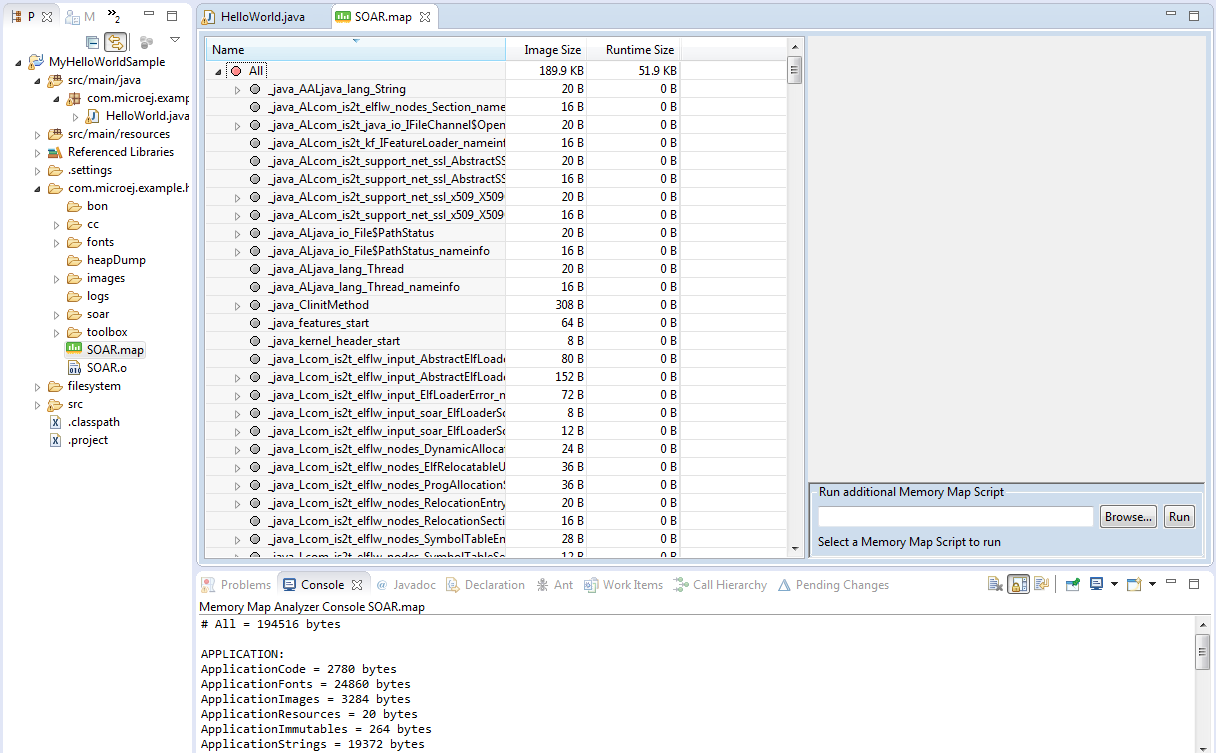
Detailed View
Troubleshooting
Memory Map Analyzer may fail while opening a Memory Map file saying Could not read this file.
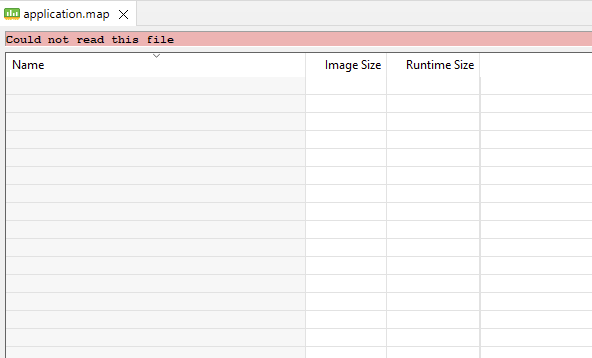
Error displayed when Memory Map file could not be read
This may happen if the Memory Map Analyzer cannot find a VEE Port to interpret the Memory Map file.
To workaround this, you can open your Memory Map file with a text editor and add the following line inside the lscfmap block:
<property name="jpf.dir" value="C:\path\to\your\vee"/>
For example:
<lscmap name="default">
   <property name="jpf.dir" value="C:\path\to\your\vee"/>
   <property name="vendorUrl" value="http://developer.microej.com/4.0/sdk/license"/>
   ...
If a line defining the jpf.dir already exists, check if the value corresponds to a valid path.
Note
The path must be the directory of a built VEE Port. If you build a Kernel Application, the
VEE Port will be available in the build/vee directory of your Gradle project.