
VEE Debugger Proxy
Principle
The VEE debugger proxy is an implementation of the Java Debug Wire protocol (JDWP) for debugging Applications executed by MICROEJ VEE. It consists of a TCP server implementing the JDWP protocol and acting as a proxy between the IDE (debugger) and the Executable (debuggee) running on the device.
The debugger proxy allows a postmortem debug from a snapshot of the memory (core dump file for Linux/QNX targets and Intel Hex file for MCU targets) of a running Executable binary.
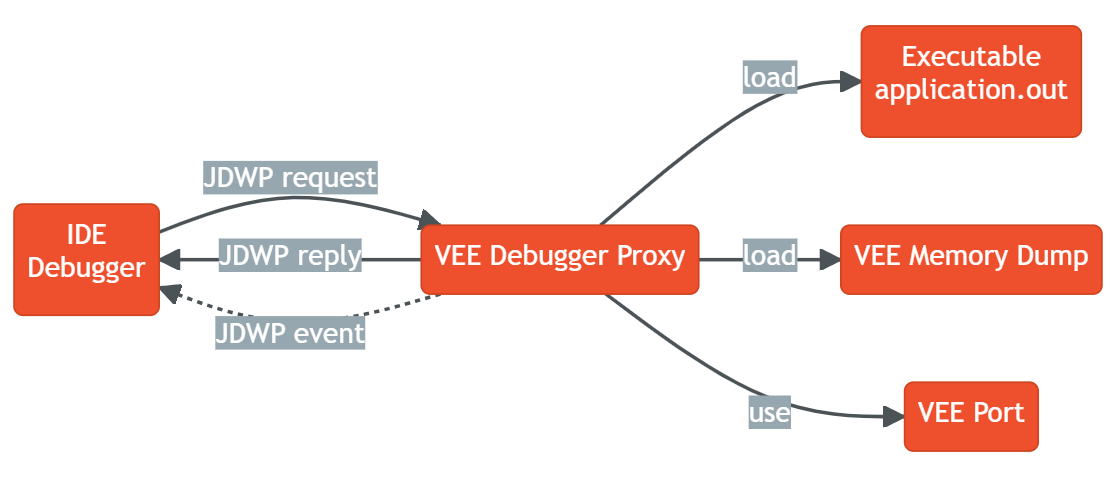
Debugger Proxy Principle
Warning
The snapshot of the memory (core dump or Intel Hex files) should only be generated when the Core Engine task is stopped on one of the Core Engine hooks (LLMJVM_on_OutOfMemoryError_thrown, LLMJVM_on_Runtime_gc_done etc.) or in a native function.
Otherwise, the Core Engine memory dump is not guaranteed to be consistent, which may cause the VEE Debugger to crash abruptly.
Note
This feature requires Architecture version 8.1.0 or higher and works for both Mono-Sandbox and Multi-Sandbox Executables.
Installation
Download the VEE Debugger Proxy tool jdwp-server-[version].jar at https://forge.microej.com/artifactory/microej-sdk6-repository-release/com/microej/tool/jdwp-server/1.0.5/jdwp-server-1.0.5.jar .
Debugging Executable for Linux or QNX target
In order to debug an Executable for Linux or QNX target, you need to dump the memory of the running Executable and then run the VEE Debugger Proxy.
For Linux and QNX target, the memory dump must be a core dump file.
Generate a Core Dump File using GDB
Open a shell terminal on the device and enter the following commands:
# Instruct the Linux kernel to Dump file-backed private mappings.
echo 0x37 > /proc/self/coredump_filter
# Start GDB
gdb ./application.out
The following GDB script can be used to generate a core dump file:
when the signal
SIGUSR1is receivedor when an out of memory error occurs
or when an explicit garbage collection (GC) is done.
You can run the script directly in the GDB console.
## From GBD documentation:
## generate-core-file [file]
##   Produce a core dump of the inferior process.
##   The optional argument file specifies the file name where to put the core dump.
##   If not specified, the file name defaults to 'core.pid', where pid is the inferior process ID.

## Generate a core dump when the signal SIGUSR1 is received
catch signal SIGUSR1
commands
silent
generate-core-file
cont
end

## Generate a core dump when an out of memory error occurs
break LLMJVM_on_OutOfMemoryError_thrown
commands
silent
generate-core-file
cont
end

## Generate a core dump when an explicit garbage collection (GC) is done
break LLMJVM_on_Runtime_gc_done
commands
silent
generate-core-file
cont
end
Starts executing the Mono-Sandbox Executable under GDB:
# In the GDB console:
run
A core dump file will be generated once the Executable reach one of the breaking conditions described previously.
Run the VEE Debugger Proxy
Open a shell terminal on your workstation and run the following command:
java -DveePortDir=<path to VEE Port directory> \
    -Ddebugger.port=<8000> \
    -Ddebugger.out.path=<path to the Executable file (application.out)> \
    -Ddebugger.features.out.path=<comma-separated list of the Feature files with debug information (*.fodbg files). To be used if you want to debug an installed Sandboxed Application> \
    -Ddebugger.out.coredump.path=<path to the core dump file> \
    -jar jdwp-server-[version].jar
Open the SDK and run a Remote Java Application Launch to debug your code.
Debugging Executable for MCU target
The VEE Debugger Proxy for MCU target requires a memory dump of the running Executable in Intel Hex format. It provides a tool to generate a script for IAR (IAR8 or IAR9) or GDB debugger, that contains the needed commands to dump the required memory regions in Intel Hex format.
Generate VEE memory dump script
Open a shell terminal on your workstation and run the following command:
java -DveePortDir=<path to VEE Port directory> \
    -Ddebugger.out.path=<path to the Executable file (application.out)> \
    -cp jdwp-server-[version].jar com.microej.jdwp.VeeDebuggerCli \
    --debugger=IAR8|IAR9|GDB \
    --output=<Output directory where the script file will be generated>
A script file named vee-memory-dump.mac (for IAR) or vee-memory-dump.gdb (for GDB) is generated into the specified output directory.
You can now use this script to dump the memory of the running Executable.
Dump the memory of the running Executable
Note
You must use a version of IAR Workbench for which the vee-memory-dump.mac script file is generated.
A script file generated for IAR 8.x will not work on IAR Workbench 9.x and vice versa.
In IAR Embedded Workbench:
Register the generated
vee-memory-dump.macscript file in the debugger project option:Open the Debugger Project option window by clicking on
Project > Options... > Debugger > SetupCheck the option
Use macro file(s)and browse to the generatedvee-memory-dump.macfile.Click on
OKto confirm.
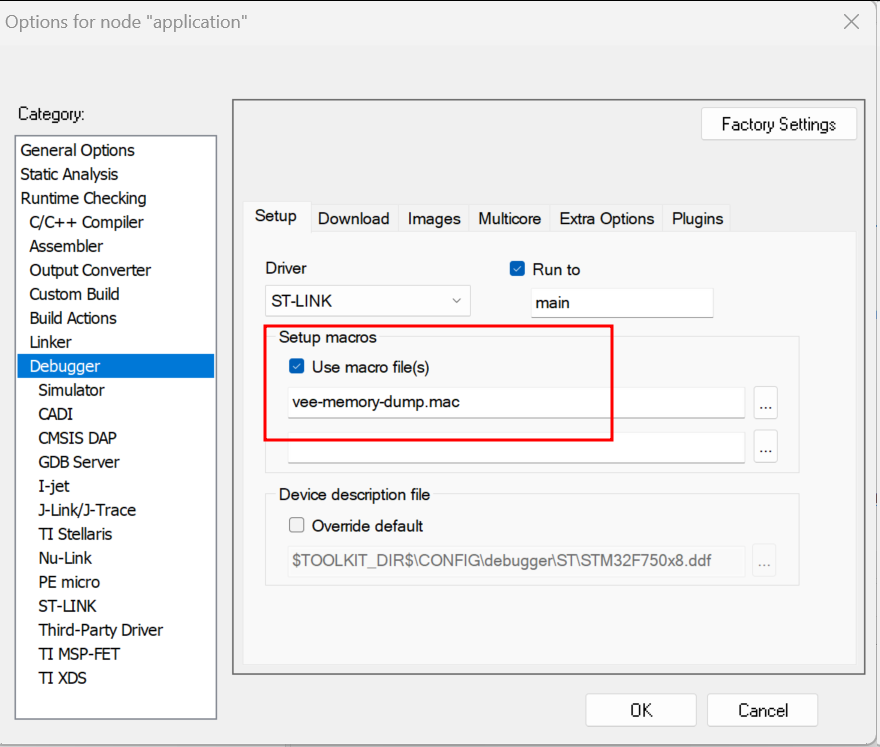
IAR Debugger Project Option
Add the macro
dumpMemories()as an action expression to a code breakpoint:Open IAR Breakpoints window by clicking on
View > BreakpointsRight click on IAR Breakpoints window and select
New Breakpoint > CodeIn the
Expressiontext field, enterdumpMemories()and click onOK
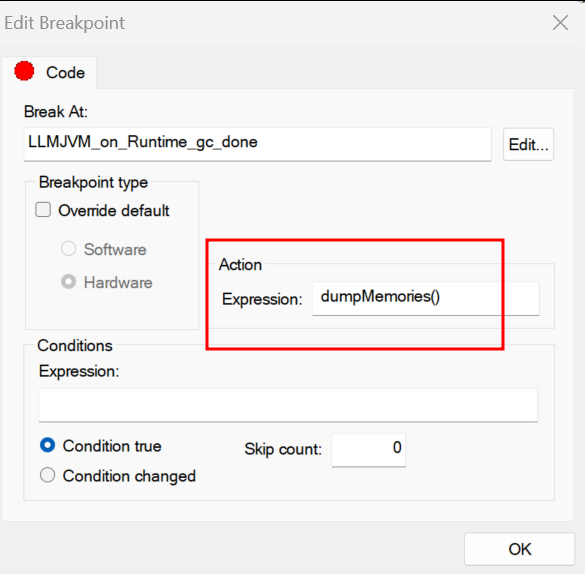
IAR Breakpoint editor
When the IAR Debugger hits the specified breakpoint, the dumpMemories() macro function is executed and the memory is dumped into *.hex files.
The *.hex files are generated in the same directory as the vee-memory-dump.mac file.
In your GDB console:
Create a breakpoint at a specific safe point (Core Engine hooks or native function)
# E.g. Add breakpoint at LLMJVM_on_Runtime_gc_done hook
break LLMJVM_on_Runtime_gc_done
run
When the running Executable stops at the Breakpoint, run the
vee-memory-dump.gdbscript file to dump the memory.
# E.g. Run the GDB memory dump script
source [/path/to]/vee-memory-dump.gdb
The memory is dumped into *.hex files in the same directory as the vee-memory-dump.gdb file.
Start the VEE Debugger Proxy
Open a shell terminal on your workstation and run the following command:
java -DveePortDir=<path to VEE Port directory> \
    -Ddebugger.port=<8000> \
    -Ddebugger.out.path=<path to the Executable file (application.out)> \
    -Ddebugger.features.out.path=<comma-separated list of the Feature files with debug information (*.fodbg files). To be used if you want to debug an installed Sandboxed Application> \
    -Ddebugger.out.hex.path=<comma-separated list of the memory dump files in Intel Hex format or a single file containg all the dumped memory> \
    -jar jdwp-server-[version].jar
Open the SDK and run a Remote Java Application Launch to debug your code.
Note
If you have multiple *.hex files generated in the previous step, you can if you want merge them into a single *.hex file.
It will be easier to use a single *.hex file than multiple files in the Debugger Proxy command line.
You can run the following shell script to merge all the *.hex files into a single file called all.hex for example.
Make sure to move to the directory where *.hex files are generated before running the script.
On Windows workstation
set ALL_HEX="all.hex"
rem delete all.hex file if it exists
if exist "%ALL_HEX%" (del /f %ALL_HEX%)
rem merge all the *.hex files
copy /b *.hex %ALL_HEX%
On Linux workstation
#!/usr/bin/bash
ALL_HEX="all.hex"
#delete all.hex file if it exists
test -f $ALL_HEX && rm $ALL_HEX
#merge all the *.hex files
cat *.hex > $ALL_HEX
Now, use this single all.hex file as value to the Debugger Proxy option -Ddebugger.out.hex.path
Update the State of the Debugged Application
While the VEE Debugger Proxy is active, you can debug a new application state without restarting it. Simply replace the old memory dump files with the new ones, and the VEE Debugger Proxy will automatically reload the state. After that, relaunch the Remote Java Application Launch.
VEE Debugger Proxy Options Summary
veePortDir: The path to the VEE Port directory (must point to the source folder of the VEE Port.).
debugger.port: The TCP server port, defaults to
8000.debugger.out.path: The Path to the Executable file to debug (
application.out).debugger.features.out.path: comma-separated list of the Feature files with debug information (
*.fodbg files). This option must be used if you want to debug an installed Sandboxed Application. In this case, note that the specified Executable indebugger.out.pathoption must be the Multi-Sandbox Executable.debugger.out.coredump.path: The Path to the core dump file (conflict with debugger.out.hex.path option).
debugger.out.hex.path: The Path to the memory dump files in Intel Hex format (conflict with debugger.out.coredump.path option). If you have multiple Intel Hex files, you can either merge them into a single file or list them with a comma separator, such as
[/path/to]/java_heap.hex,[/path/to]/java_stacks.hex,[/path/to]/vm_instance.hex.
Troubleshooting
You may encounter some command line issues if you try to run the proxy on Windows PowerShell.
On Windows workstation, we recommend using CMD Command Prompt instead.