
Warning
This documentation is for SDK 5. The latest major version is SDK 6. SDK 5 is in maintenance mode since the release of SDK 5.8.0. Consequently, as stated in the SDK End User License Agreement (EULA), the SDK will reach the end of its life by July 2028. Contact our support team for assistance with migrating to the new SDK, or your sales representative if you require an extension of SDK maintenance as a service.
Stack Trace Reader
Principle
Stack Trace Reader is a MicroEJ tool that reads and decodes the MicroEJ
stack traces. When an exception occurs, the Core Engine prints
the stack trace on the standard output System.out. The class names,
non-required types names(see Types),
and method names obtained are encoded with a MicroEJ internal format.
This internal format prevents embedding all class names and
method names in the executable image to save some memory space. The Stack
Trace Reader tool allows you to decode the stack traces by replacing the
internal class names and method names with their real names. It also
retrieves the line numbers in the MicroEJ Application.
Functional Description
The Stack Trace Reader reads the debug information from the fully linked ELF file (the ELF file that contains the Core Engine, the other libraries, the BSP, the OS, and the compiled MicroEJ Application). It prints the decoded stack trace.
When Multi-Sandbox capability is enabled, the Stack Trace Reader can simultaneously decode heterogeneous stack traces with lines owned by different MicroEJ Sandboxed Applications and the firmware. Lines owned by the firmware can be decoded with the firmware debug information file (optionally made available by your firmware provider).
Dependencies
No dependency.
Installation
This tool is a built-in Architecture tool.
Use (Standalone Application)
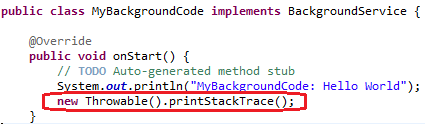
For example, write the following new line to dump the currently executed stack trace on the standard output.
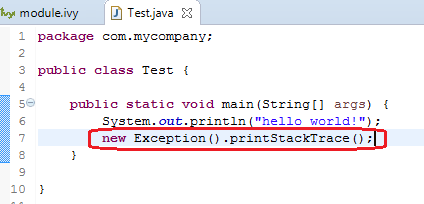
Code to Dump a Stack Trace
To decode an application stack trace, the Stack Trace Reader tool requires the application executable ELF file.
In the case of a platform with full BSP connection (see BSP Connection Cases), the file is application.out in the output folder.
In the other cases, the ELF file is generated by the C toolchain when building the BSP project (usually a .out or .axf file).
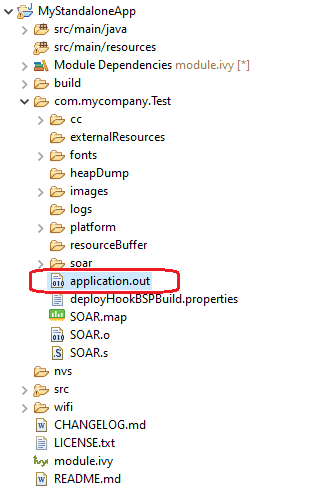
Application Binary File
On successful deployment, the application is started on the device and the following trace is dumped on standard output.
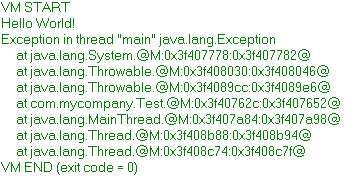
Stack Trace Output
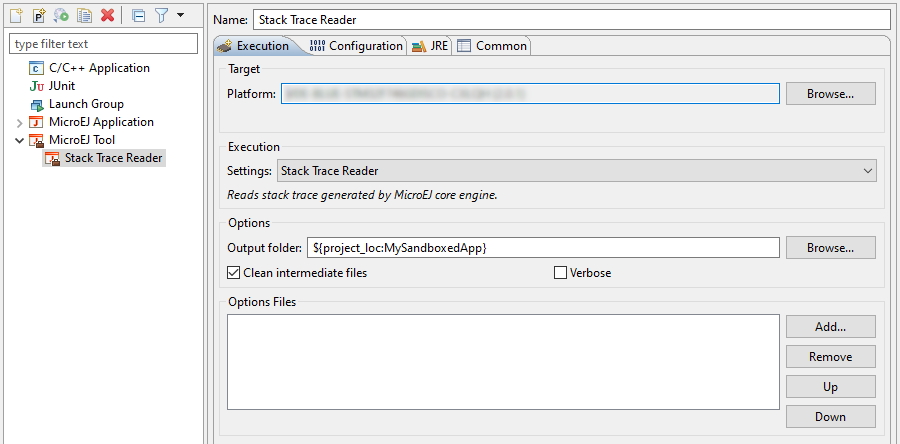
To create a new MicroEJ Tool configuration, right-click on the application project and click on Run As… > Run Configurations….
Create a new MicroEJ Tool configuration. In the Execution tab, select your target platform, then select the Stack Trace Reader tool. Set an output folder in the Output folder field.
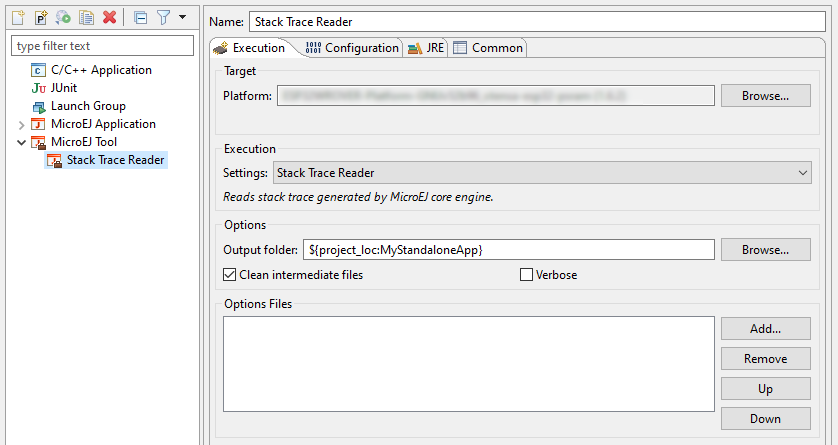
Stack Trace Reader Tool Configuration (Platform Selection)
In Configuration tab, browse the previously generated application
binary file with debug information (application.out in case of a Standalone Application with full BSP connection)
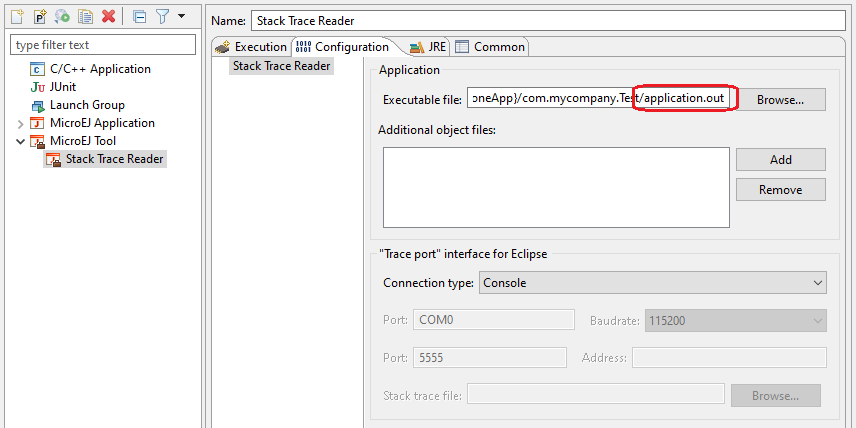
Stack Trace Reader Tool Configuration (Standalone Application)
Click on Run button and copy/paste the trace into the Eclipse console. The decoded trace is dumped and the line corresponding to the application hook is now readable.
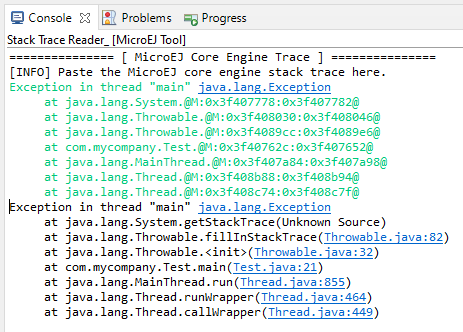
Stack Trace Reader Console
Use (Sandboxed Application)
For example, write the following new line to dump the currently executed stack trace on the standard output.
Code to Dump a Stack Trace
To decode an application stack trace, the Stack Trace Reader
tool requires the application binary file with debug information
(application.fodbg in the output folder). Note that the file
uploaded on the device is application.fo (stripped version
without debug information).
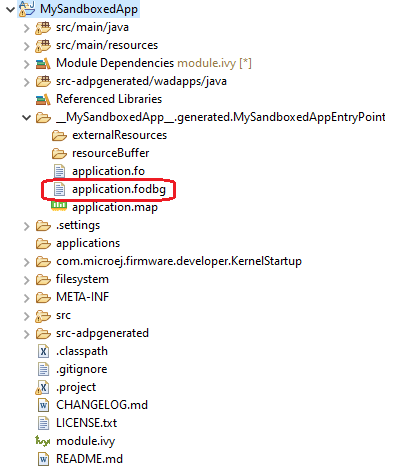
Application Binary File with Debug Information
On successful deployment, the application is started on the device and the following trace is dumped on standard output.
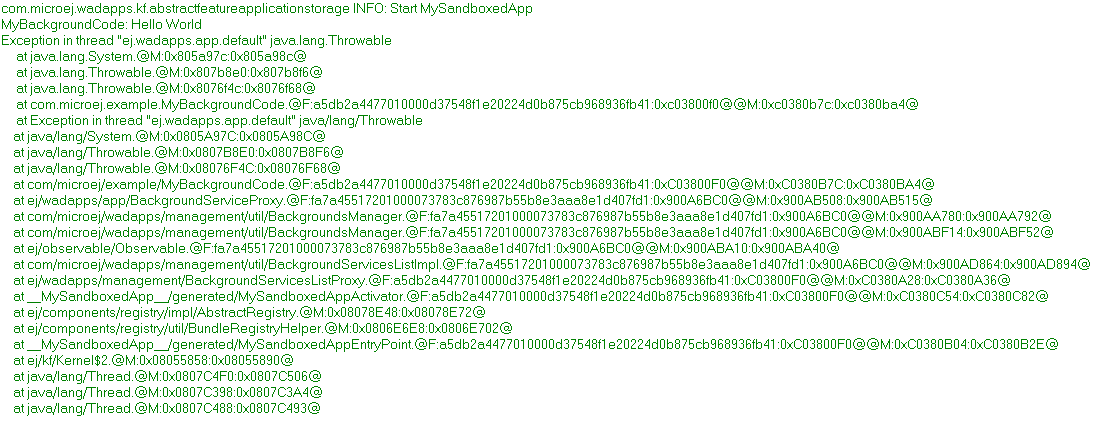
Stack Trace Output
To create a new MicroEJ Tool configuration, right-click on the application project and click on Run As… > Run Configurations….
Create a new MicroEJ Tool configuration. In the Execution tab, select your target platform, then select the Stack Trace Reader tool. Set an output folder in the Output folder field.
Stack Trace Reader Tool Configuration (Virtual Device Selection)
In the Configuration tab, if the Kernel executable file is available to you (usually named firmware.out and located in your Virtual Device files), you can browse for it in the Executable file field,
and then add your previously generated application binary file with debug information (application.fodbg in case of a Sandboxed
Application) in the Additional object files field.
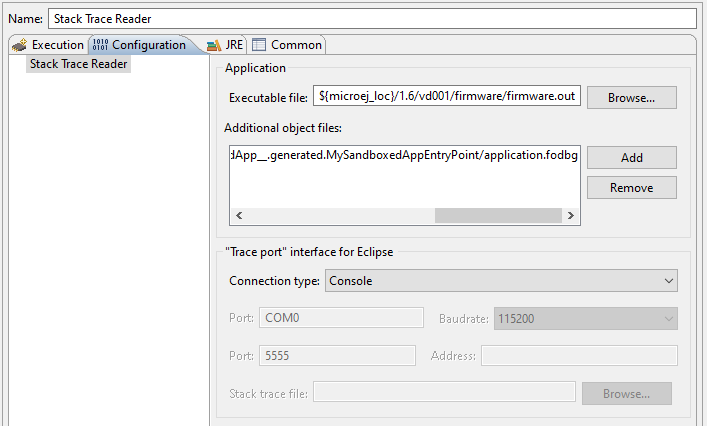
Select the Kernel Executable File
To check where the Kernel executable file of your Virtual Device is located, if you have access to it, go to Window > Preferences > MicroEJ > Virtual Devices, hover over your Virtual Device in the list and wait until an information popup appears. Press F2 to get all the informations and the path to the directory of your Virtual Device should appear in the list.
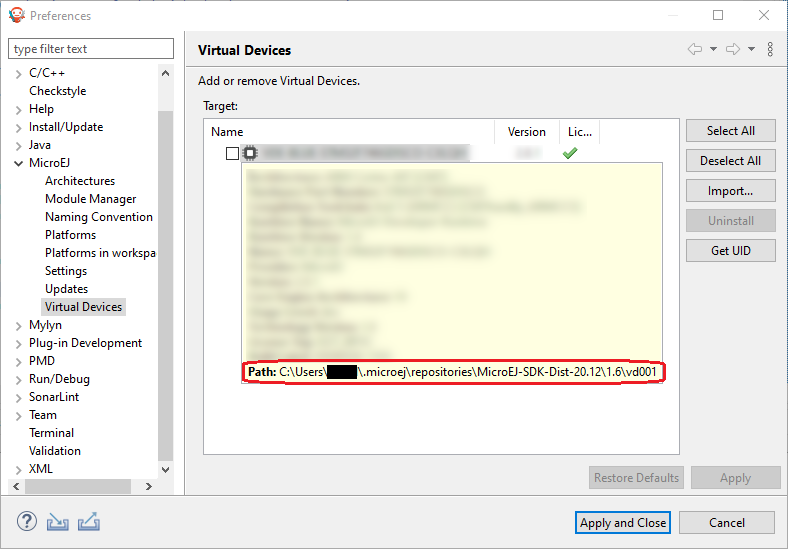
Location of the Virtual Device Directory
In this directory, the Kernel executable file should be named firmware.out in the /firmware sub-directory.
If you do not have access to the Kernel executable file, you can still get some information from the Stack Trace Reader using the application binary file only. In the Configuration tab, browse the previously generated application binary file with debug information (application.fodbg in case of a Sandboxed Application)
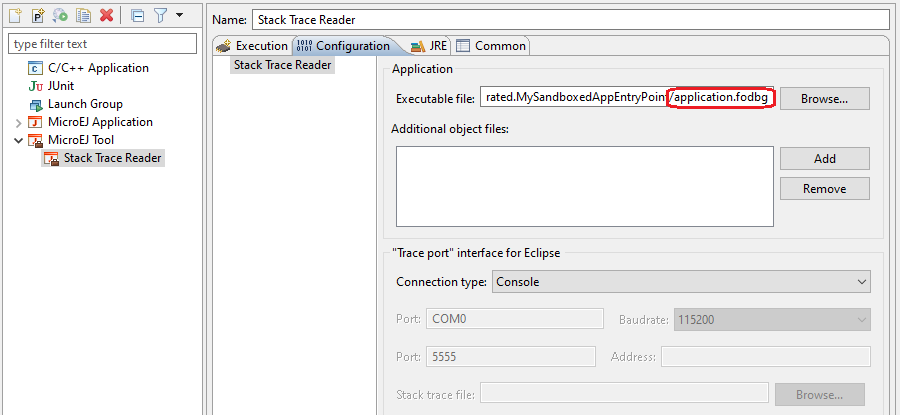
Stack Trace Reader Tool Configuration (Sandboxed Application)
Click on Run button and copy/paste the trace into the Eclipse console. The decoded trace is dumped and the line corresponding to the application hook is now readable.
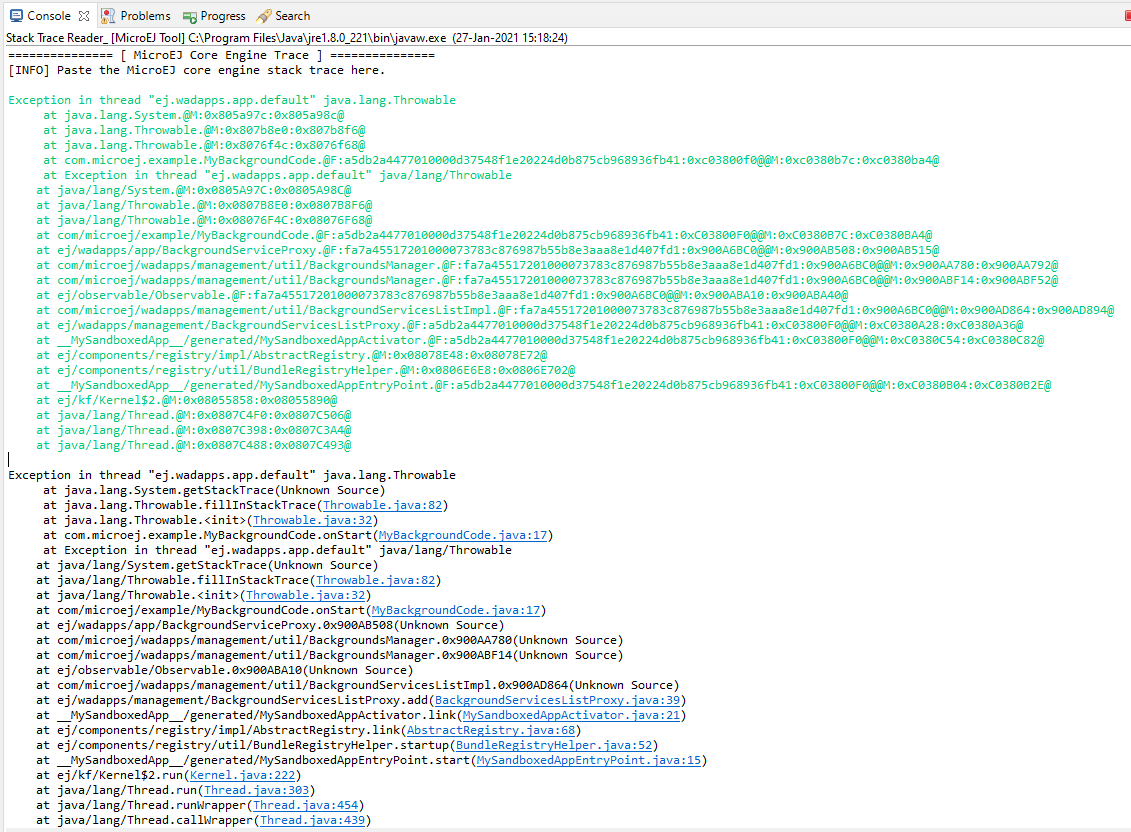
Stack Trace Reader Console
Other debug information files can be appended using the Additional object files option.
Stack Trace Reader Options
The following section explains MicroEJ tool options.
Category: Stack Trace Reader
Group: Application
Option(browse): Executable file
Option Name: application.file
Default value: (empty)
Description:
Specify the full path of a full linked elf file.
Option(list): Additional object files
Option Name: additional.application.files
Default value: (empty)
Group: “Trace port” interface for Eclipse
Description:
This group describes the hardware link between the device and the PC.
Option(combo): Connection type
Option Name: proxy.connection.connection.type
Default value: Console
Available values:
Uart (COM)
Socket
File
Console
Description:
Specify the connection type between the device and PC.
Option(text): Port
Option Name: pcboardconnection.usart.pc.port
Default value: COM0
Description:
Format: port name
Specifies the PC COM port:
Windows - COM1, COM2, ..., COM*n*
Linux - /dev/ttyS0, /dev/ttyS1, ..., /dev/ttyS*n*
Option(combo): Baudrate
Option Name: pcboardconnection.usart.pc.baudrate
Default value: 115200
Available values:
9600
38400
57600
115200
Description:
Defines the COM baudrate for PC-Device communication.
Option(text): Port
Option Name: pcboardconnection.socket.port
Default value: 5555
Description:
IP port.
Option(text): Address
Option Name: pcboardconnection.socket.address
Default value: (empty)
Description:
IP address, on the form A.B.C.D.
Option(browse): Stack trace file
Option Name: pcboardconnection.file.path
Default value: (empty)