
Warning
This documentation is for SDK 5. The latest major version is SDK 6. SDK 5 is in maintenance mode since the release of SDK 5.8.0. Consequently, as stated in the SDK End User License Agreement (EULA), the SDK will reach the end of its life by July 2028. Contact our support team for assistance with migrating to the new SDK, or your sales representative if you require an extension of SDK maintenance as a service.
Heap Dumper & Heap Analyzer
Introduction
Heap Dumper is a tool that takes a snapshot of the heap. Generated files
(with the .heap extension) are available in the application output
folder.
The Heap Analyzer is a set of tools to help developers understand the contents of the Managed Heap and find problems such as memory leaks. For its part, the Heap Analyzer plugin is able to open dump files. It helps you analyze their contents thanks to the following features:
memory leaks detection
objects instances browse
heap usage optimization (using immortal or immutable objects)
The Heap
The heap is a memory area used to hold Java objects created at runtime. Objects persist in the heap until they are garbage collected. An object becomes eligible for garbage collection when there are no longer any references to it from other objects.
Heap Dump
A heap dump is an XML file that provides a snapshot of the heap contents at the moment the file is created. It contains a list of all the instances of both class and array types that exist in the heap. For each instance, it records:
The time at which the instance was created
The thread that created it
The method that created it
For instances of class types, it also records:
The class
The values in the instance’s non-static fields
For instances of array types, it also records:
The type of the contents of the array
The contents of the array
For each referenced class type, it records the values in the static fields of the class.
Heap Analyzer Tools
The Heap Analyzer is an Eclipse plugin that adds three tools to the MicroEJ environment.
Tool name
Number of input files
Purpose
Heap Viewer
1
Shows what instances are in the heap, when they were created, and attempts to identify problem areas
Progressive Heap Usage
1 or more
Shows how the number of instances in the heap has changed over time
Compare
2
Compares two heap dumps, showing which objects were created, or garbage collected, or have changed values
Heap Dumper
The Heap Dumper generates .heap files. There are two implementations:
Integrated with the Simulator: Dumps
.heapfiles directly from the Managed Heap.Heap Dumper Tool: Generates
.heapfiles from.hexfiles, which must be retrieved from the device using tools like GDB.
Heap dumps should be performed after a call to System.gc() to exclude discardable objects.
Simulator
To generate a Heap dump of an application running on the Simulator:
Set the
s3.inspect.heapapplication property totrue.Update your application code to call the System.gc() method where you need a Heap dump.
Run the application on the Simulator.
When the System.gc() method is called:
If called from the application, the
.heapfile is generated in thebuild/output/<fqnMainClass>/heapDump/folder of the project, where<fqnMainClass>is the Fully Qualified Name of the application’s main class, e.g.,com.mycompany.Main.If called from a test class, the
.heapfile is generated in thebuild/testsuite/output/<buildDate>/bin/<fqnMainClass>/heapDump/folder of the project, where<fqnMainClass>is the Fully Qualified Name of the generated main class and<buildDate>is the test execution date, e.g.,build/testsuite/output/20240625-1605-24/bin/com.mycompany._AllTests_MyTest/heapDump/.
Device
To generate a Heap dump of an application running on a device:
Update your application code to call the System.gc() method where you need a Heap dump.
Build the executable and deploy it on the device.
Start a debug session.
Add a breakpoint to the
LLMJVM_on_Runtime_gc_doneCore Engine hook. This function is called by the Core Engine when the System.gc() method is done. Alternatively, for out of memory errors, add a breakpoint to theLLMJVM_on_OutOfMemoryError_thrownCore Engine hook.Resume execution until the breakpoint is reached. You are now ready to dump the memory.
Note
Core Engine hooks may be inlined by the third-party linker. If the symbol is not accessible to the debugger, declare them in your VEE Port:
void LLMJVM_on_Runtime_gc_done(){
   //No need to add code to the function
}

void LLMJVM_on_OutOfMemoryError_thrown(){
   //No need to add code to the function
}
Retrieve the .hex file from the device
If you are in a Mono-Sandbox context and do not use dynamic Heap configuration, you only need to dump the Core Engine heap section. Example GDB commands:
b LLMJVM_on_Runtime_gc_done
b LLMJVM_on_OutOfMemoryError_thrown
continue
dump ihex memory heap.hex &_java_heap_start &_java_heap_end
You now have the .hex file and need to extract the Heap dump.
Otherwise, dump all MICROEJ VEE memories. See VEE memory dump for how to generate a script for your debugger that dumps all required sections.
You then have to merge all .hex files into a single one for the next step.
Convert .hex dump to .heap dump
To convert the Heap dump from .hex to .heap, use the Heap Dumper tool.
The Heap Dumper should be available in your VEE Port and can be configured and executed from the SDK Run Configurations.
From the SDK top menu, go to Run > Run Configurations...
Right-click on
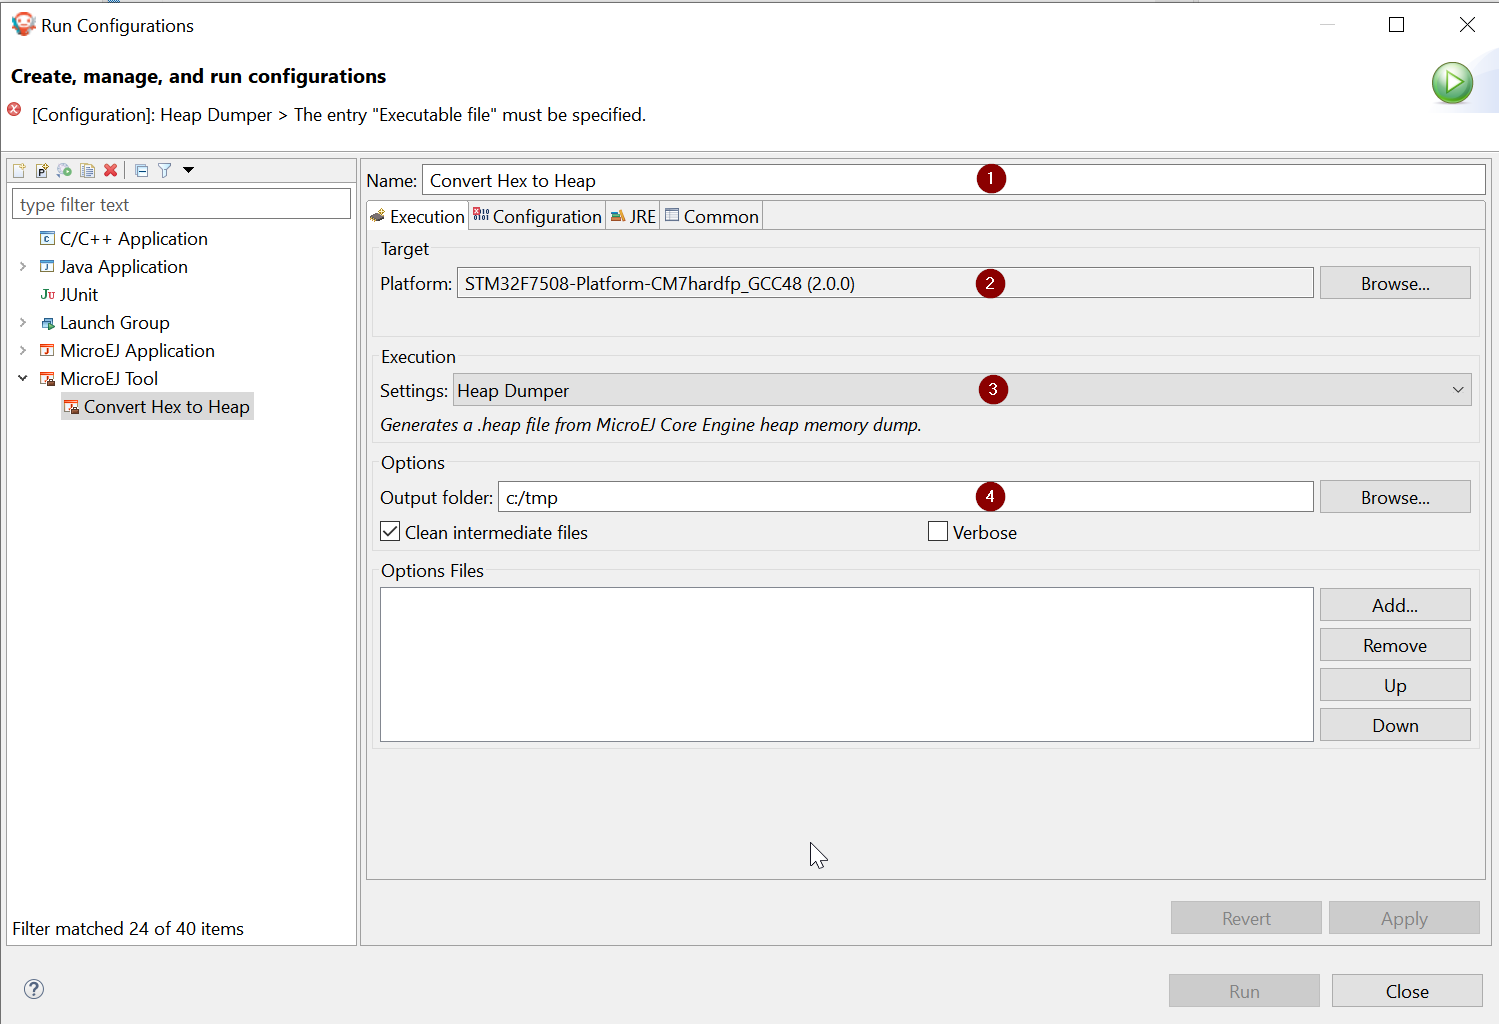
MicroEJ Tooland selectNew Configuration.Configure the
Executiontab:Set the tool name, e.g.,
Convert Hex to Heap.Select the platform in the
Target>Platformfield.Select the
Heap Dumpertool from theExecution>Settingslist.Set the
Output folderpath, where the.heapfile will be generated.
Switch to the
Configurationtab and configure it:Set the path to the firmware executable ELF file.
Add the full path of application files with debug information (
.fodbgfiles).Set the full path of the heap memory dump, in Intel Hex format.
Add the full path of additional memory files in Intel Hex format (installed feature areas, dynamic features table, etc.).
Set the heap file output name, e.g.,
application.heap.
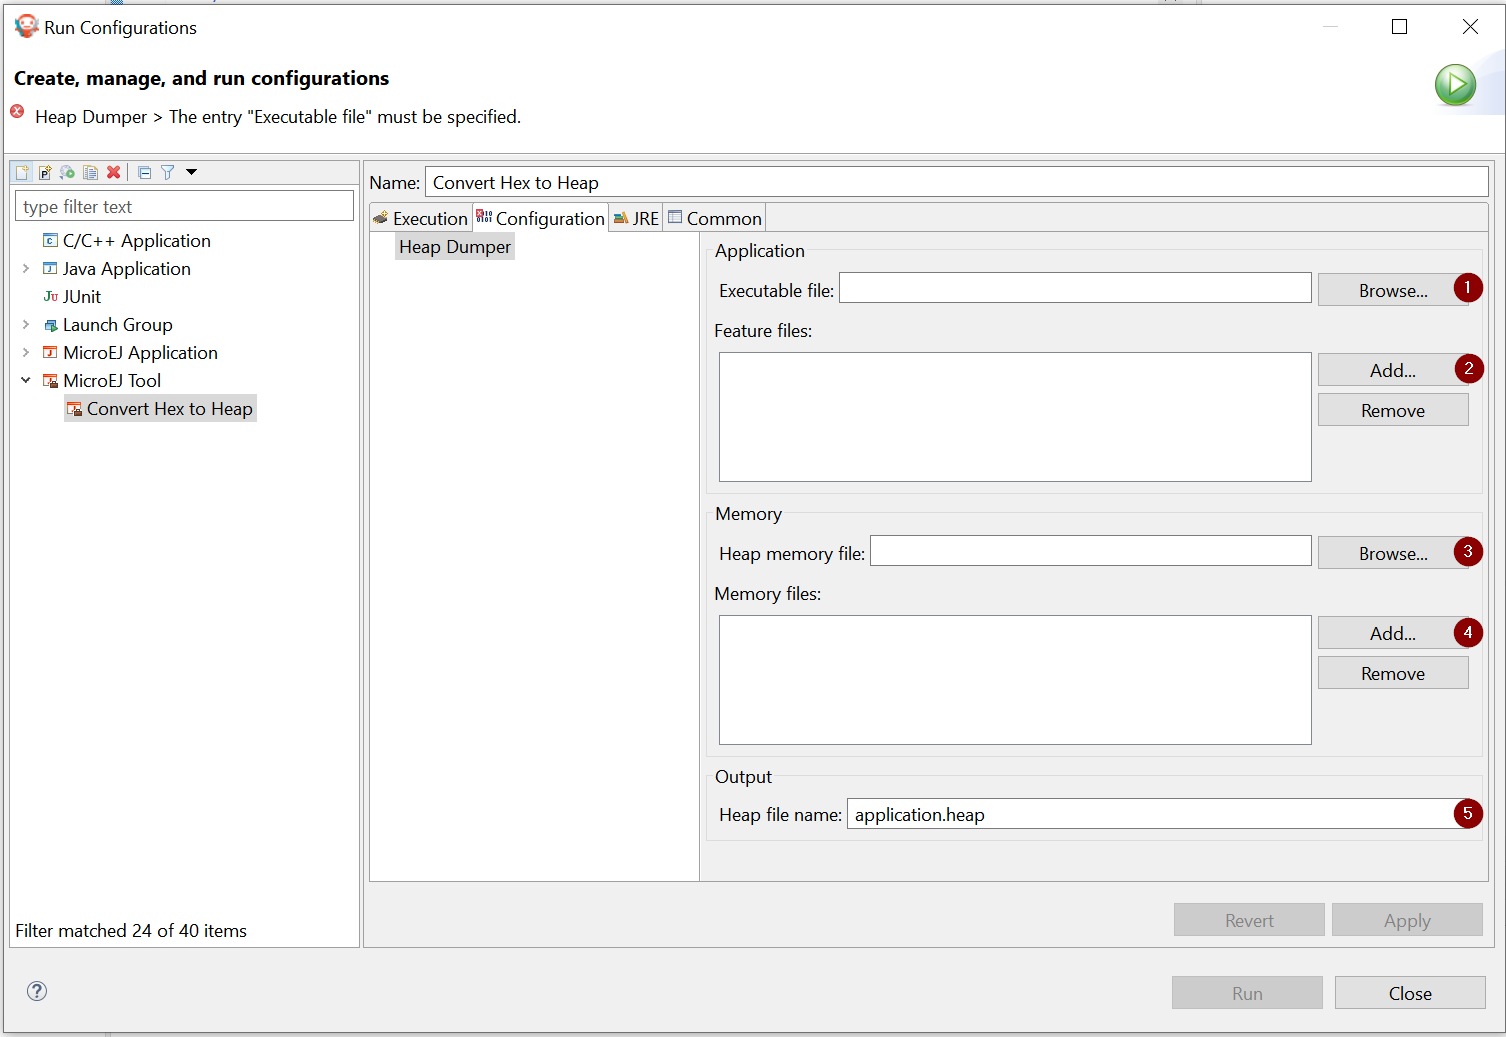
Finally, click
ApplyandRun.
Now you can open the generated .heap file in the Heap Viewer.
Heap Viewer
To open the Heap Viewer tool, select a heap dump XML file in the Package Explorer, right-click on it and select Open With > Heap Viewer
Alternatively, right-click on it and select Heap Analyzer > Open heap viewer
This will open a Heap Viewer tool window for the selected heap dump [1].
The Heap Viewer works in conjunction with two views:
The Outline view
The Instance Browser view
These views are described below.
The Heap Viewer tool has three tabs, each described below.
Outline View
The Outline view shows a list of all the types in the heap dump, and for each type shows a list of the instances of that type. When an instance is selected it also shows a list of the instances that refer to that instance. The Outline view is opened automatically when an Heap Viewer is opened.
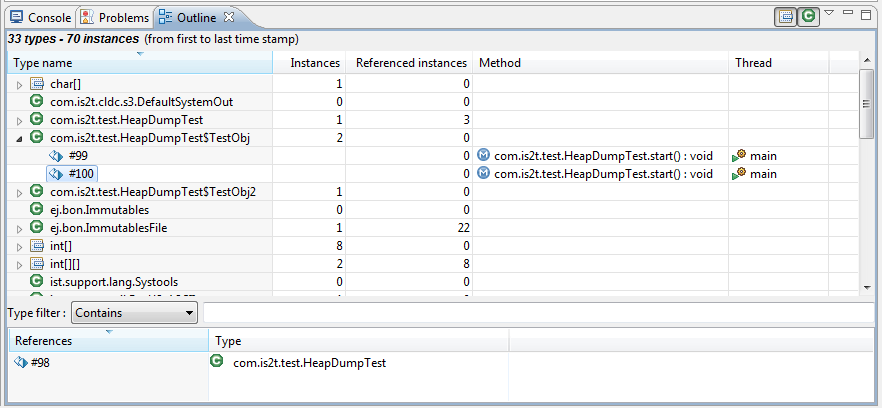
Outline View
Instance Browser View
The Instance Browser view opens automatically when a type or instance is selected in the Outline view. It has two modes, selected using the buttons in the top right corner of the view. In ‘Fields’ mode it shows the field values for the selected type or instance, and where those fields hold references it shows the fields of the referenced instance, and so on. In ‘Reference’ mode it shows the instances that refer to the selected instance, and the instances that refer to them, and so on.
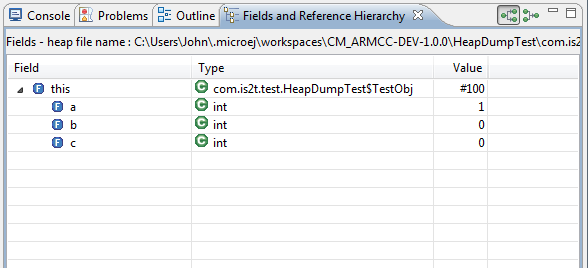
Instance Browser View - Fields mode
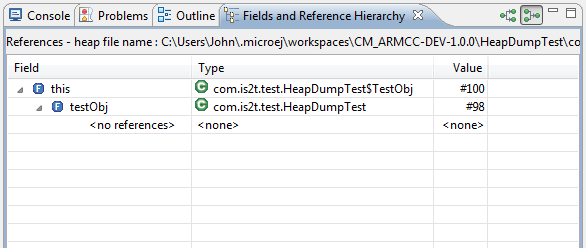
Instance Browser View - References mode
Heap Usage Tab
The Heap usage page of the Heap Viewer displays four bar charts. Each chart divides the total time span of the heap dump (from the time stamp of the earliest instance creation to the time stamp of the latest instance creation) into a number of periods along the x axis, and shows, by means of a vertical bar, the number of instances created during the period.
The top-left chart shows the total number of instances created in each period, and is the only chart displayed when the Heap Viewer is first opened.
When a type or instance is selected in the Outline view the top-right chart is displayed. This chart shows the number of instances of the selected type created in each time period.
When an instance is selected in the Outline view the bottom-left chart is displayed. This chart shows the number of instances created in each time period by the thread that created the selected instance.
When an instance is selected in the Outline view the bottom-right chart is displayed. This chart shows the number of instances created in each time period by the method that created the selected instance.
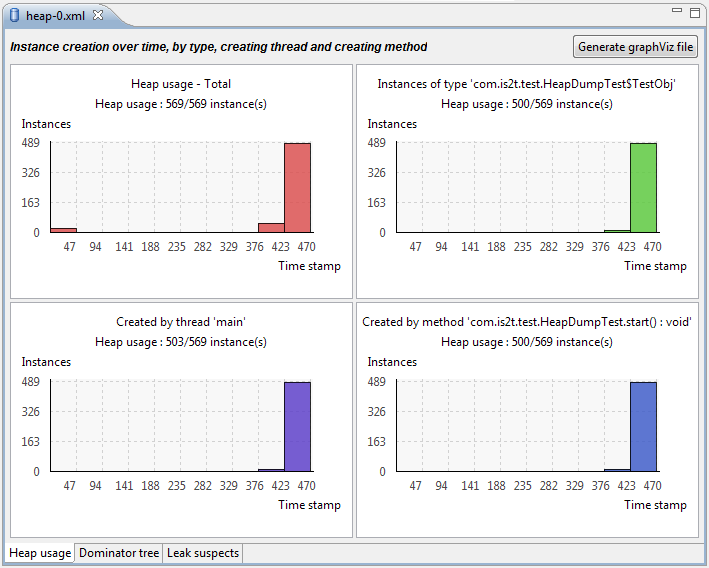
Heap Viewer - Heap Usage Tab
Clicking on the graph area in a chart restricts the Outline view to just the types and instances that were created during the selected time period. Clicking on a chart but outside of the graph area restores the Outline view to showing all types and instances [2].
The button Generate graphViz file in the top-right corner of the Heap Usage page generates a file compatible with graphviz (www.graphviz.org).
The section Heap Usage Monitoring shows how to compute the maximum heap usage.
Dominator Tree Tab
The Dominator tree page of the Heap Viewer allows the user to browse the instance reference tree which contains the greatest number of instances. This can be useful when investigating a memory leak because this tree is likely to contain the instances that should have been garbage collected.
The page contains two tree viewers. The top viewer shows the instances that make up the tree, starting with the root. The left column shows the ids of the instances – initially just the root instance is shown. The Shallow instances column shows the number of instances directly referenced by the instance, and the Referenced instances column shows the total number of instances below this point in the tree (all descendants).
The bottom viewer groups the instances that make up the tree either according to their type, the thread that created them, or the method that created them.
Double-clicking an instance in either viewer opens the Instance Browser view (if not already open) and shows details of the instance in that view.
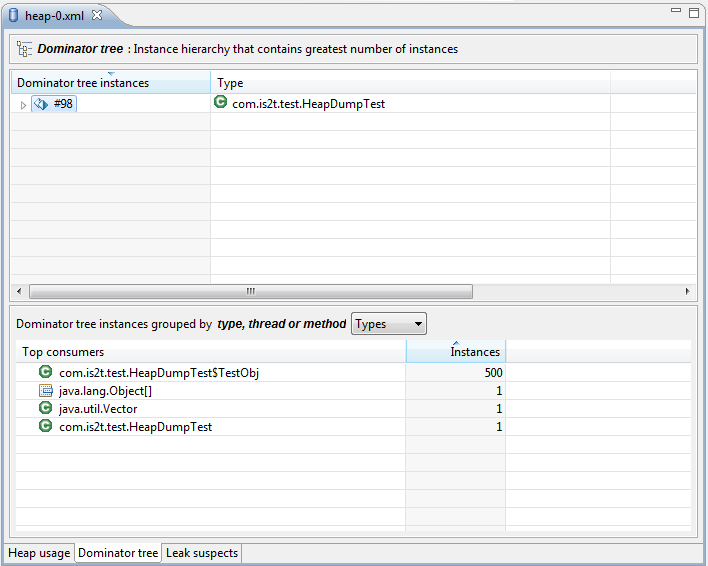
Heap Viewer - Dominator Tree Tab
Leak Suspects Tab
The Leak suspects page of the Heap Viewer shows the result of applying heuristics to the relationships between instances in the heap to identify possible memory leaks.
The page is in three parts.
The top part lists the suspected types (classes). Suspected types are classes which, based on numbers of instances and instance creation frequency, may be implicated in a memory leak.
The middle part lists accumulation points. An accumulation point is an instance that references a high number of instances of a type that may be implicated in a memory leak.
The bottom part lists the instances accumulated at an accumulation point.
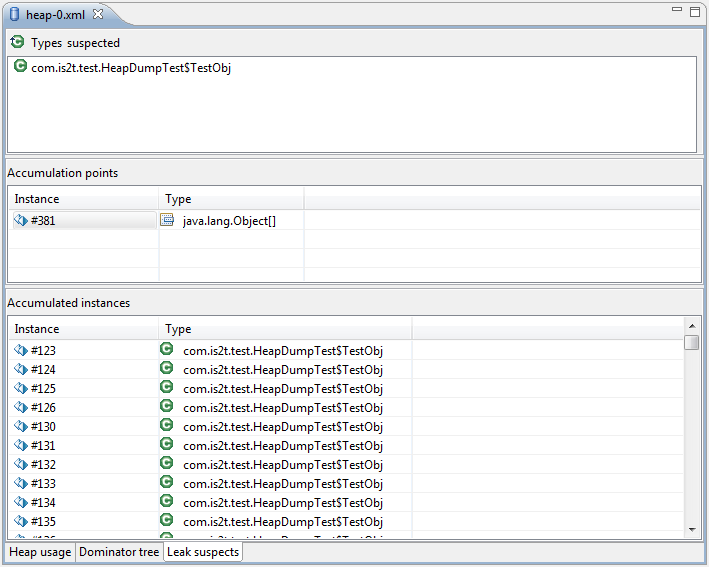
Heap Viewer - Leak Suspects Tab
Progressive Heap Usage
To open the Progressive Heap Usage tool, select one or more heap dump XML files in the Package Explorer, right-click and select Heap Analyzer > Show progressive heap usage
This tool is much simpler than the Heap Viewer described above. It comprises three parts.
The top-right part is a line graph showing the total number of instances in the heap over time, based on the creation times of the instances found in the heap dumps.
The left part is a pane with three tabs, one showing a list of types in the heap dump, another a list of threads that created instances in the heap dump, and the third a list of methods that created instances in the heap dump.
The bottom-left is a line graph showing the number of instances in the heap over time restricted to those instances that match with the selection in the left pane. If a type is selected, the graph shows only instances of that type; if a thread is selected the graph shows only instances created by that thread; if a method is selected the graph shows only instances created by that method.
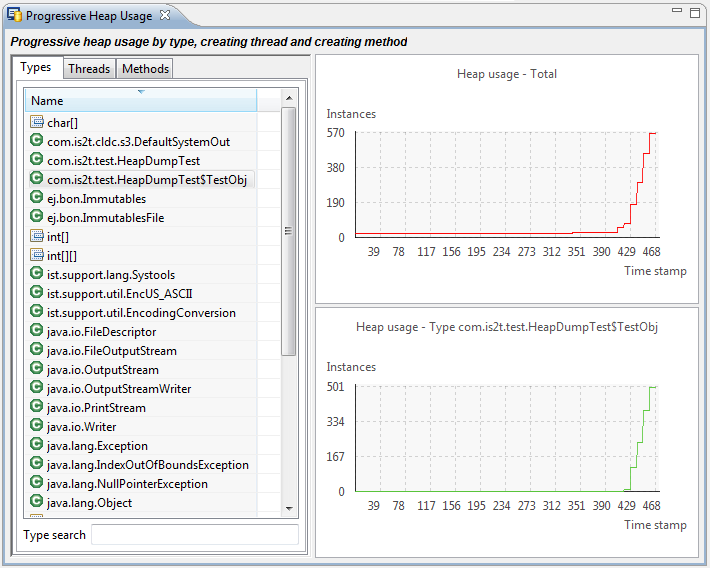
Progressive Heap Usage
Compare Heap Dumps
The Compare tool compares the contents of two heap dump files. To open the tool select two heap dump XML files in the Package Explorer, right-click and select Heap Analyzer > Compare
The Compare tool shows the types in the old heap on the left-hand side, and the types in the new heap on the right-hand side, and marks the differences between them using different colors.
Types in the old heap dump are colored red if there are one or more instances of this type which are in the old dump but not in the new dump. The missing instances have been garbage collected.
Types in the new heap dump are colored green if there are one or more instances of this type which are in the new dump but not in the old dump. These instances were created after the old heap dump was written.
Clicking to the right of the type name unfolds the list to show the instances of the selected type.
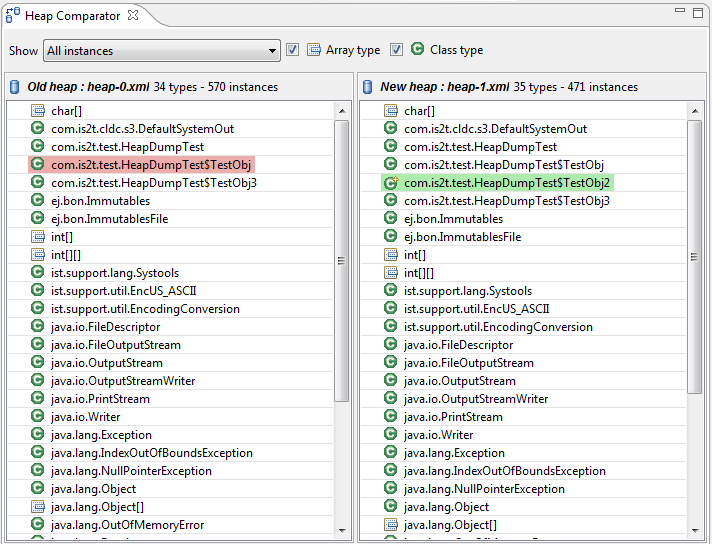
Compare Heap Dumps
The combo box at the top of the tool allows the list to be restricted in various ways:
All instances – no restriction.
Garbage collected and new instances – show only the instances that exist in the old heap dump but not in the new dump, or which exist in the new heap dump but not in the old dump.
Persistent instances – show only those instances that exist in both the old and new dumps.
Persistent instances with value changed – show only those instances that exist in both the old and new dumps and have one or more differences in the values of their fields.
Instance Fields Comparison View
The Compare tool works in conjunction with the Instance Fields Comparison view, which opens automatically when an instance is selected in the tool.
The view shows the values of the fields of the instance in both the old and new heap dumps, and highlights any differences between the values.
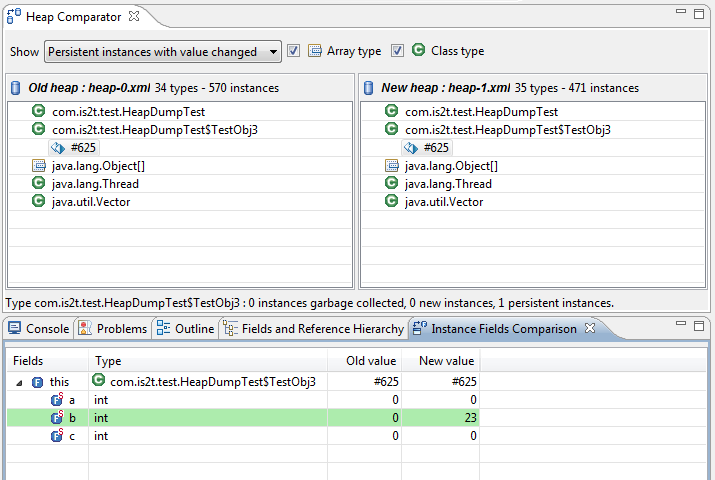
Instance Fields Comparison view